
Richer slides on the Platform — math, code, and interactive charts.
The editor gets a lot more expressive this month. If you build technical, academic, or data-heavy presentations, you can now add properly formatted equations, syntax-highlighted code, and real charts directly on a slide — no more screenshotting from other tools. You can also crop images in the editor, and new text elements pick sensible colors automatically.
What's new
Math elements
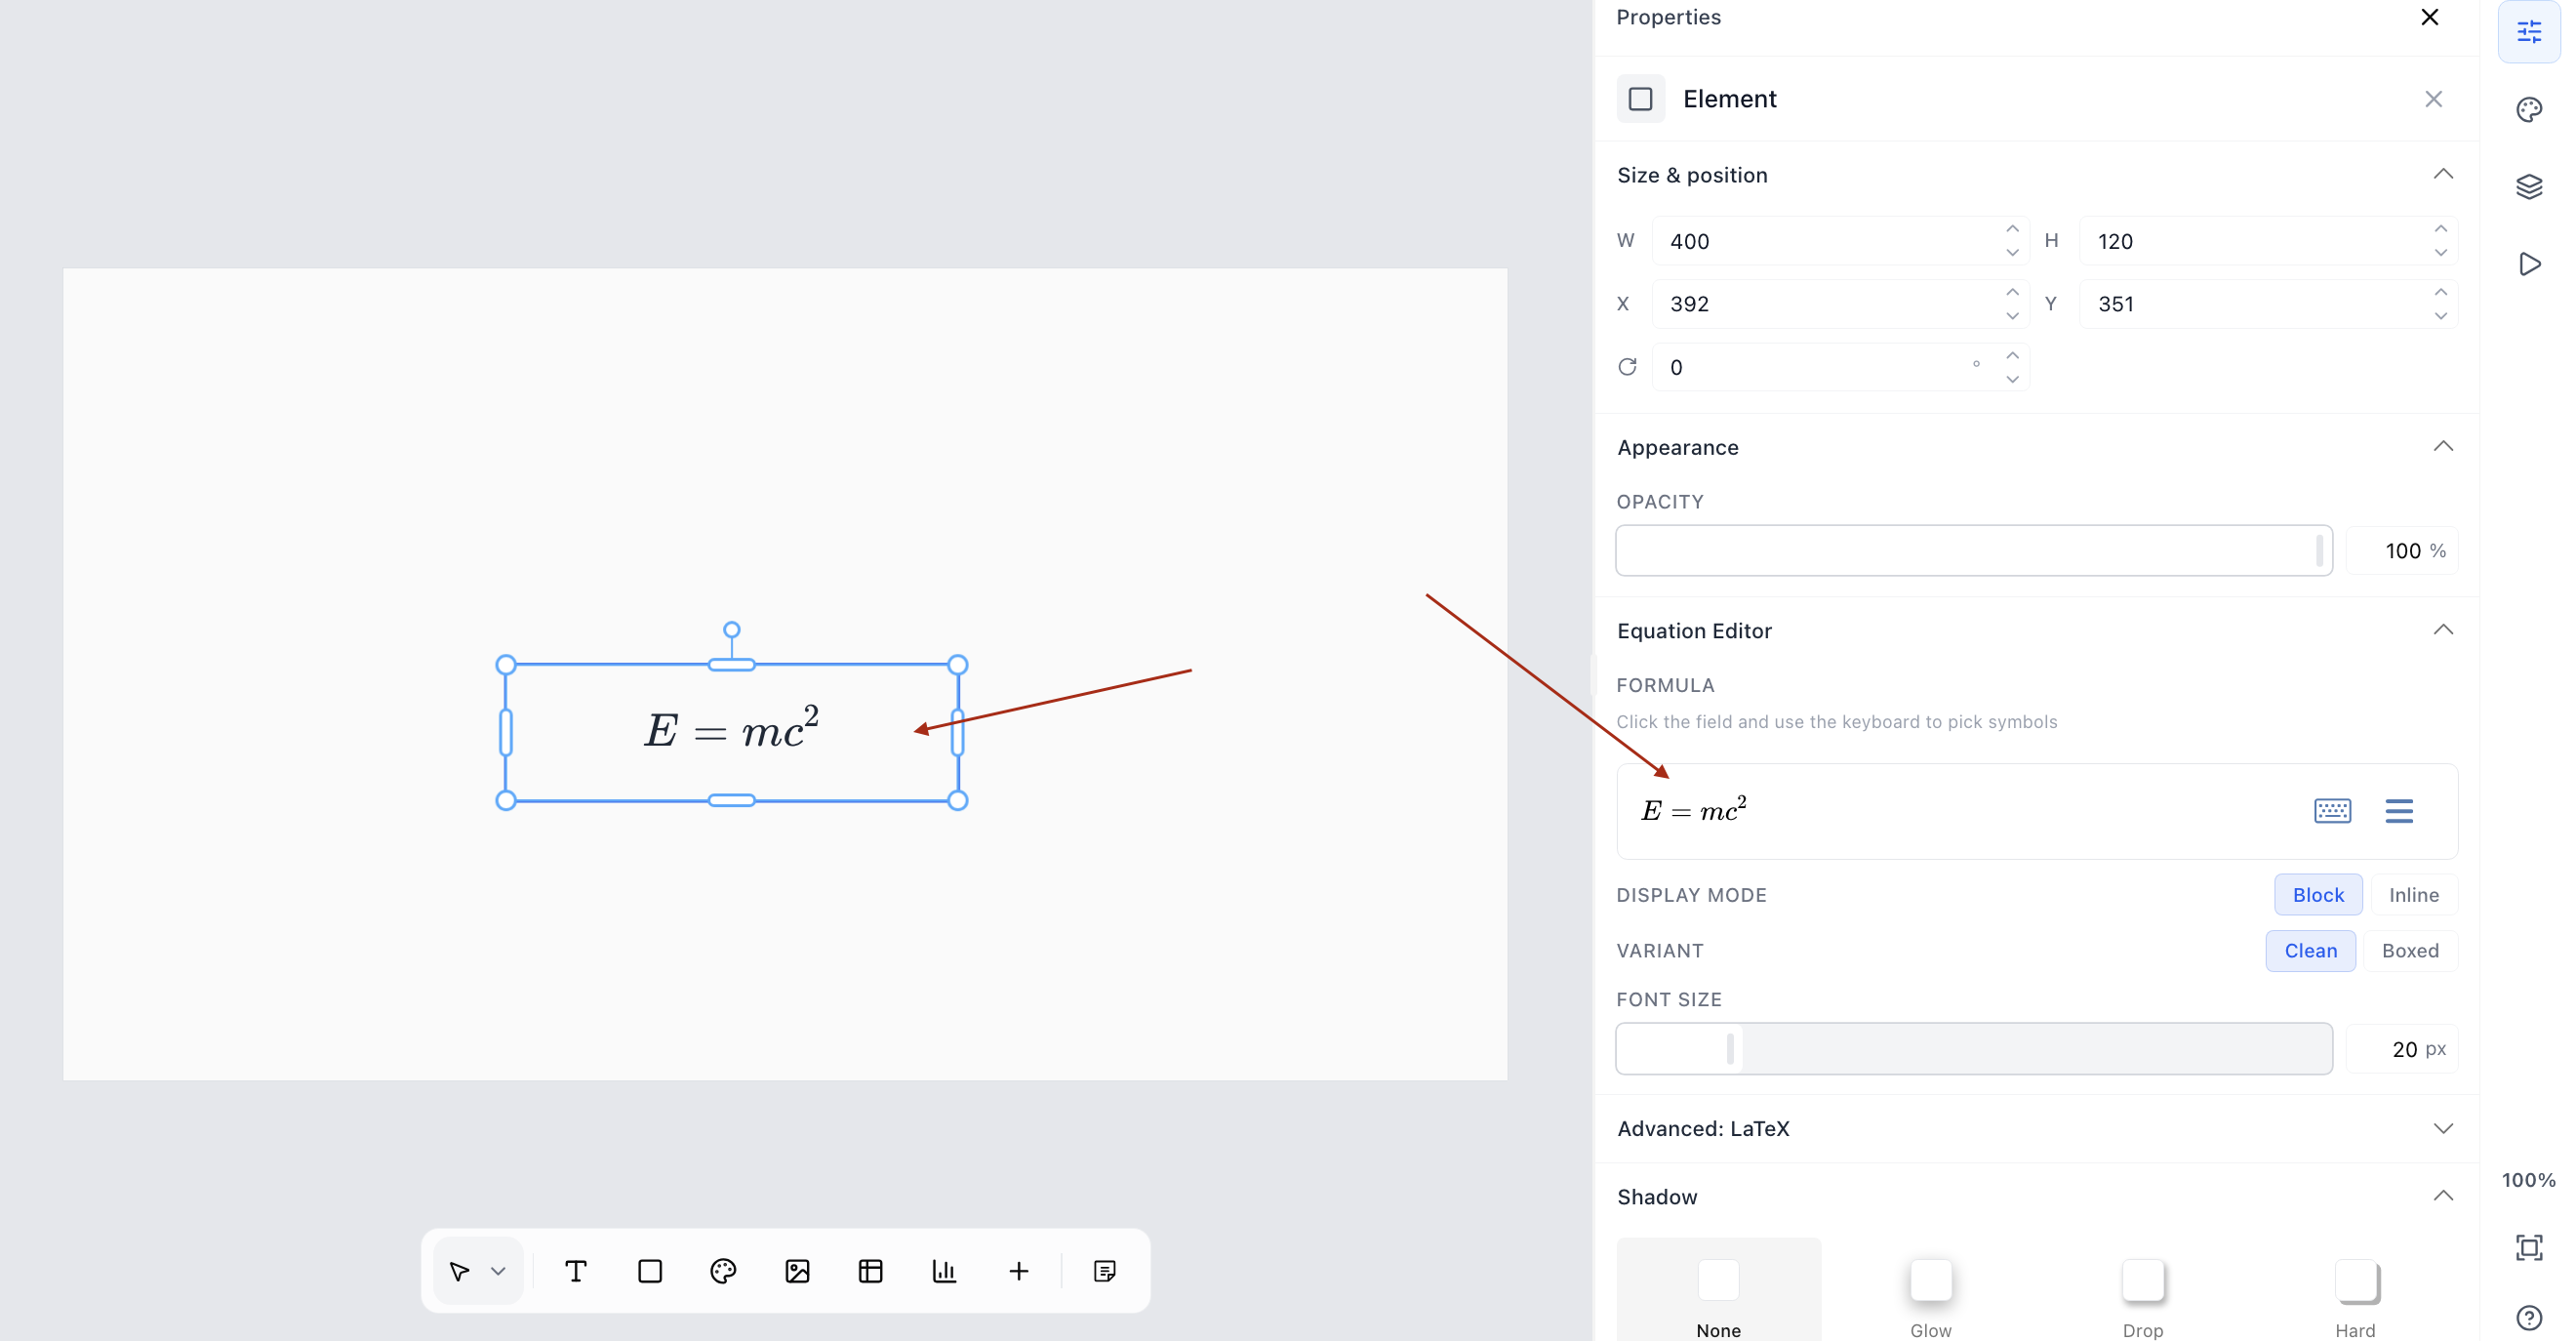
Add cleanly formatted equations right onto a slide. Ideal for lectures, research presentations, and anything STEM, where an inline image of an equation used to be the only option.
In the editor, open a slide and click More in the editing toolbar.
Click Math Formula (the button with the sigma icon).
In the right-side Equation Editor panel, enter your formula in the Formula field.
Choose Display Mode (Block or Inline) and Variant (Clean or Boxed).
Adjust Font size if needed. The equation shows live on the slide.

Code elements
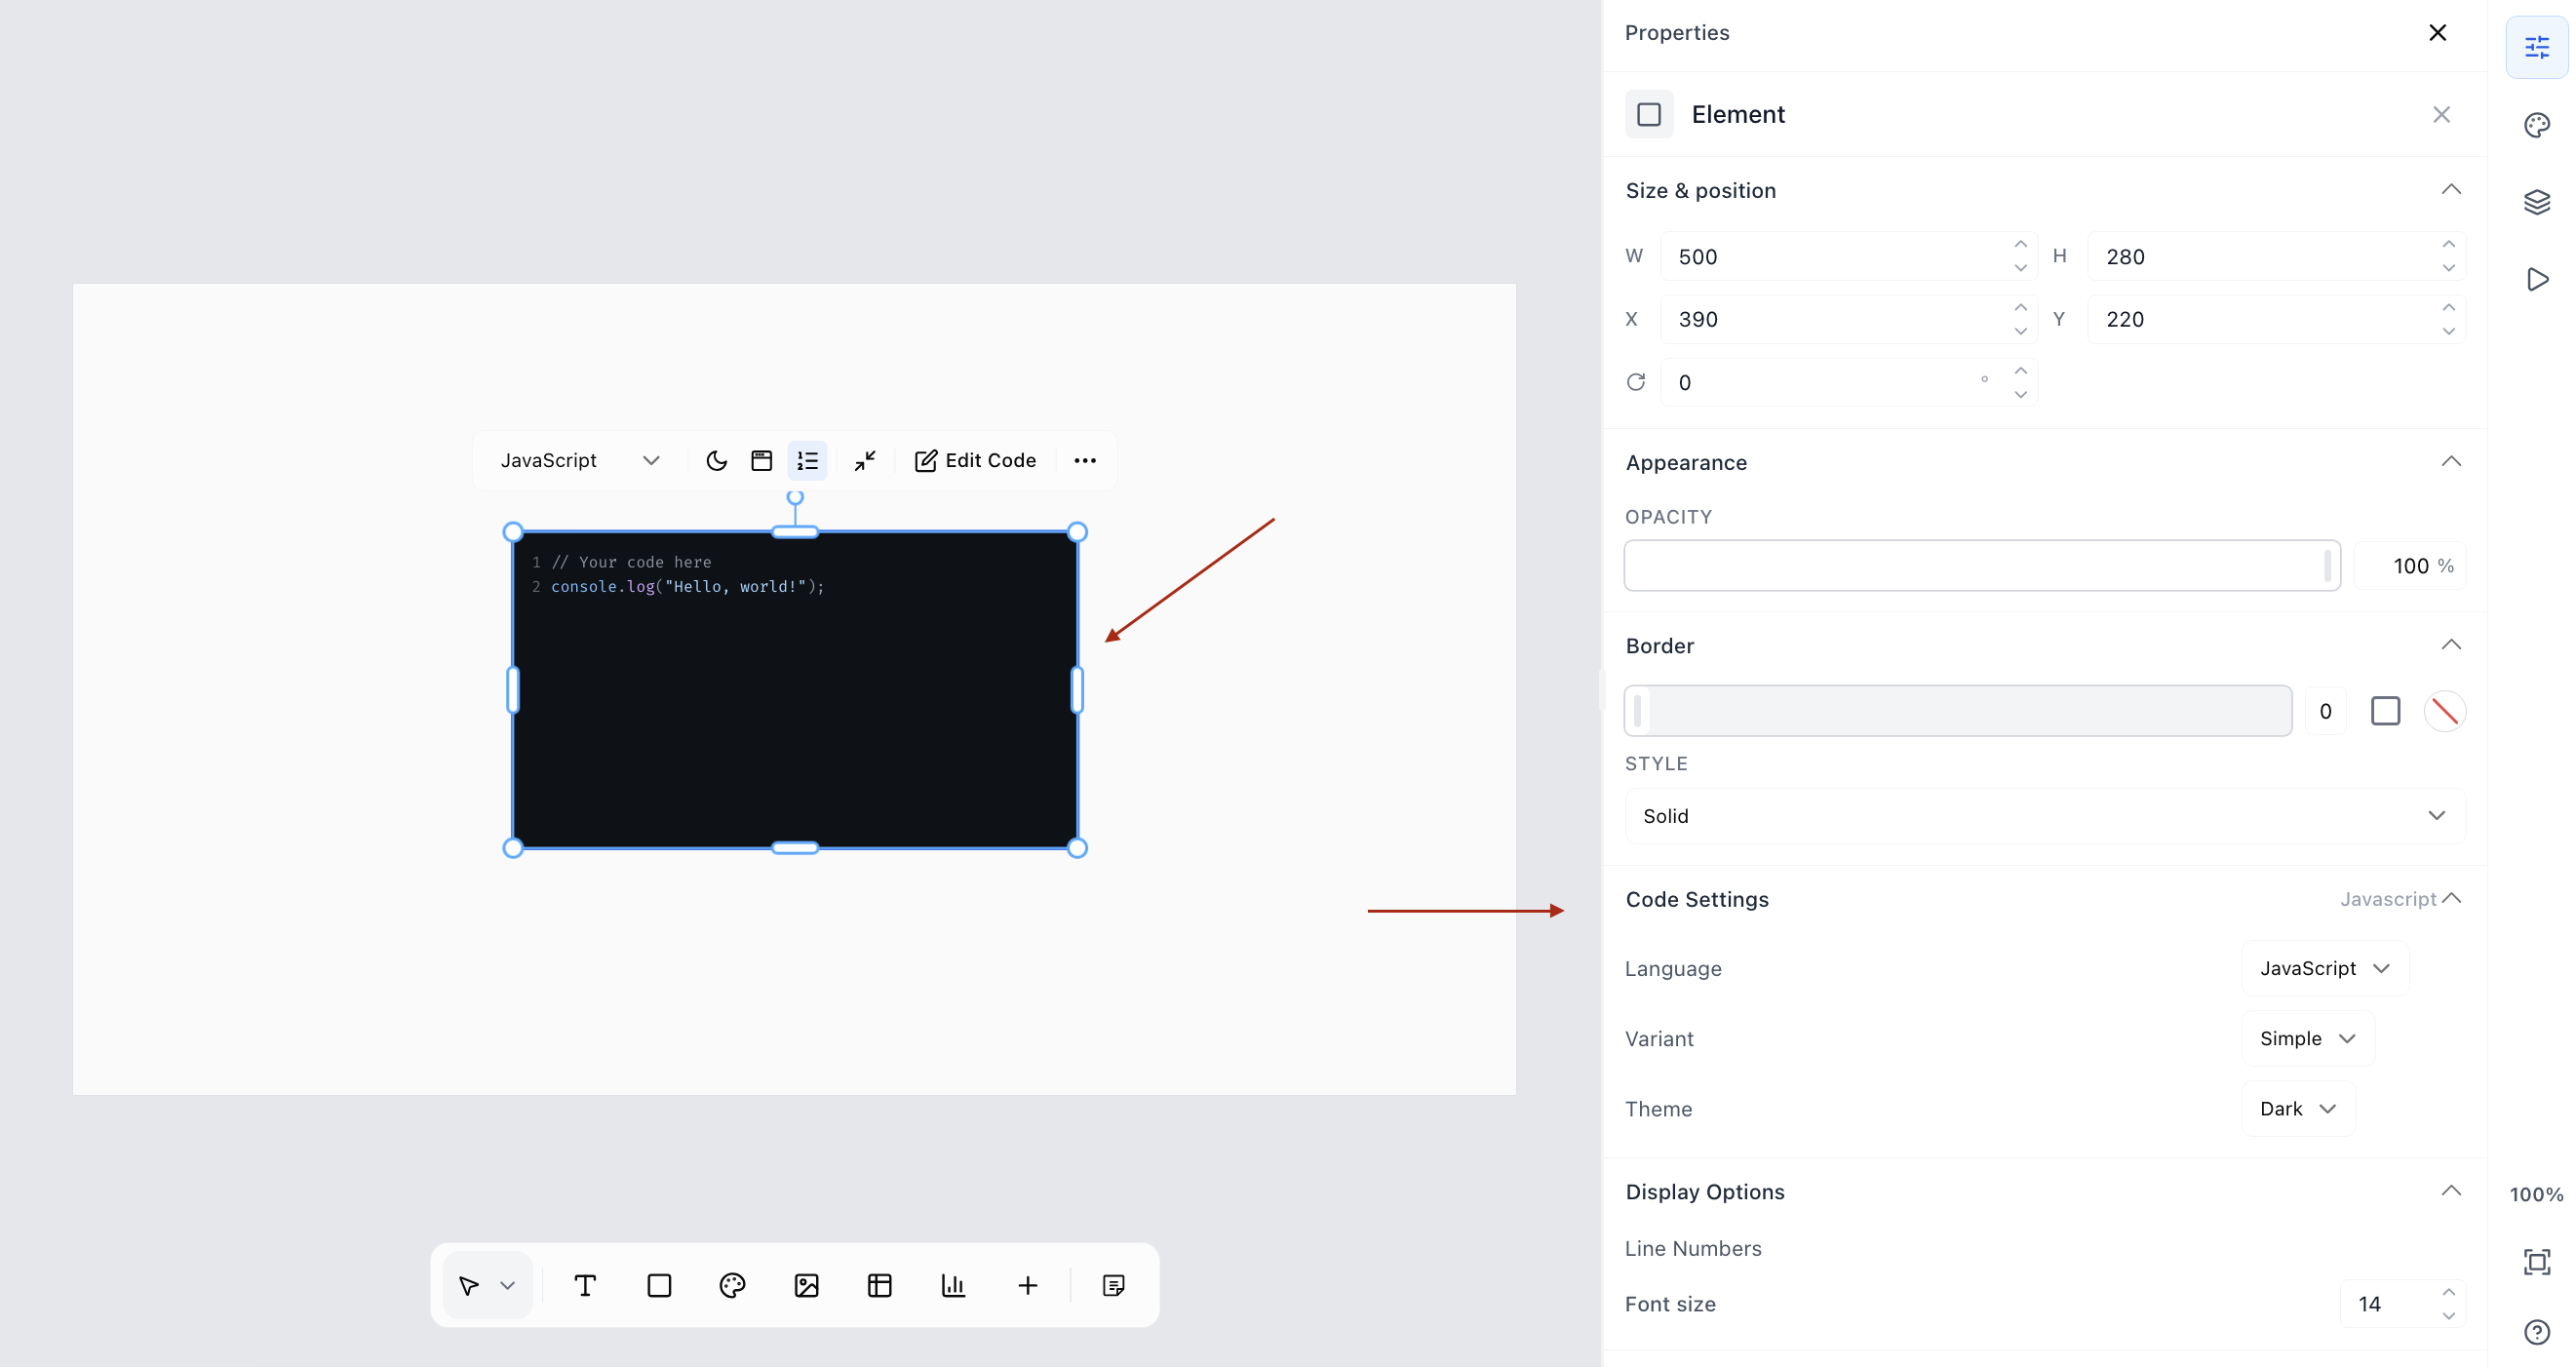
Insert syntax-highlighted code blocks so technical slides stay readable. Code keeps its formatting and highlighting instead of being pasted in as flat, hard-to-read text.
In the editor, click More in the toolbar, then select Code.
Choose the language from the dropdown (for example, JavaScript).
Click Edit Code to open the code editor and enter your snippet.
The code block shows with syntax highlighting and line numbers on the slide.

Interactive charts
Charts are now handled natively, so your data shows as a real, editable chart rather than a static image. Update the numbers and the chart updates with them.
In the editor, click More in the toolbar, then select Chart.
Pick a chart type from the options: Bar Chart, Line Chart, Area Chart, Pie Chart, or Doughnut Chart.
With the chart selected, click Edit chart data in the toolbar above the slide.
In the Edit data modal, edit categories, series names, and numeric values.
Click Update to apply the changes. The chart redraws automatically.



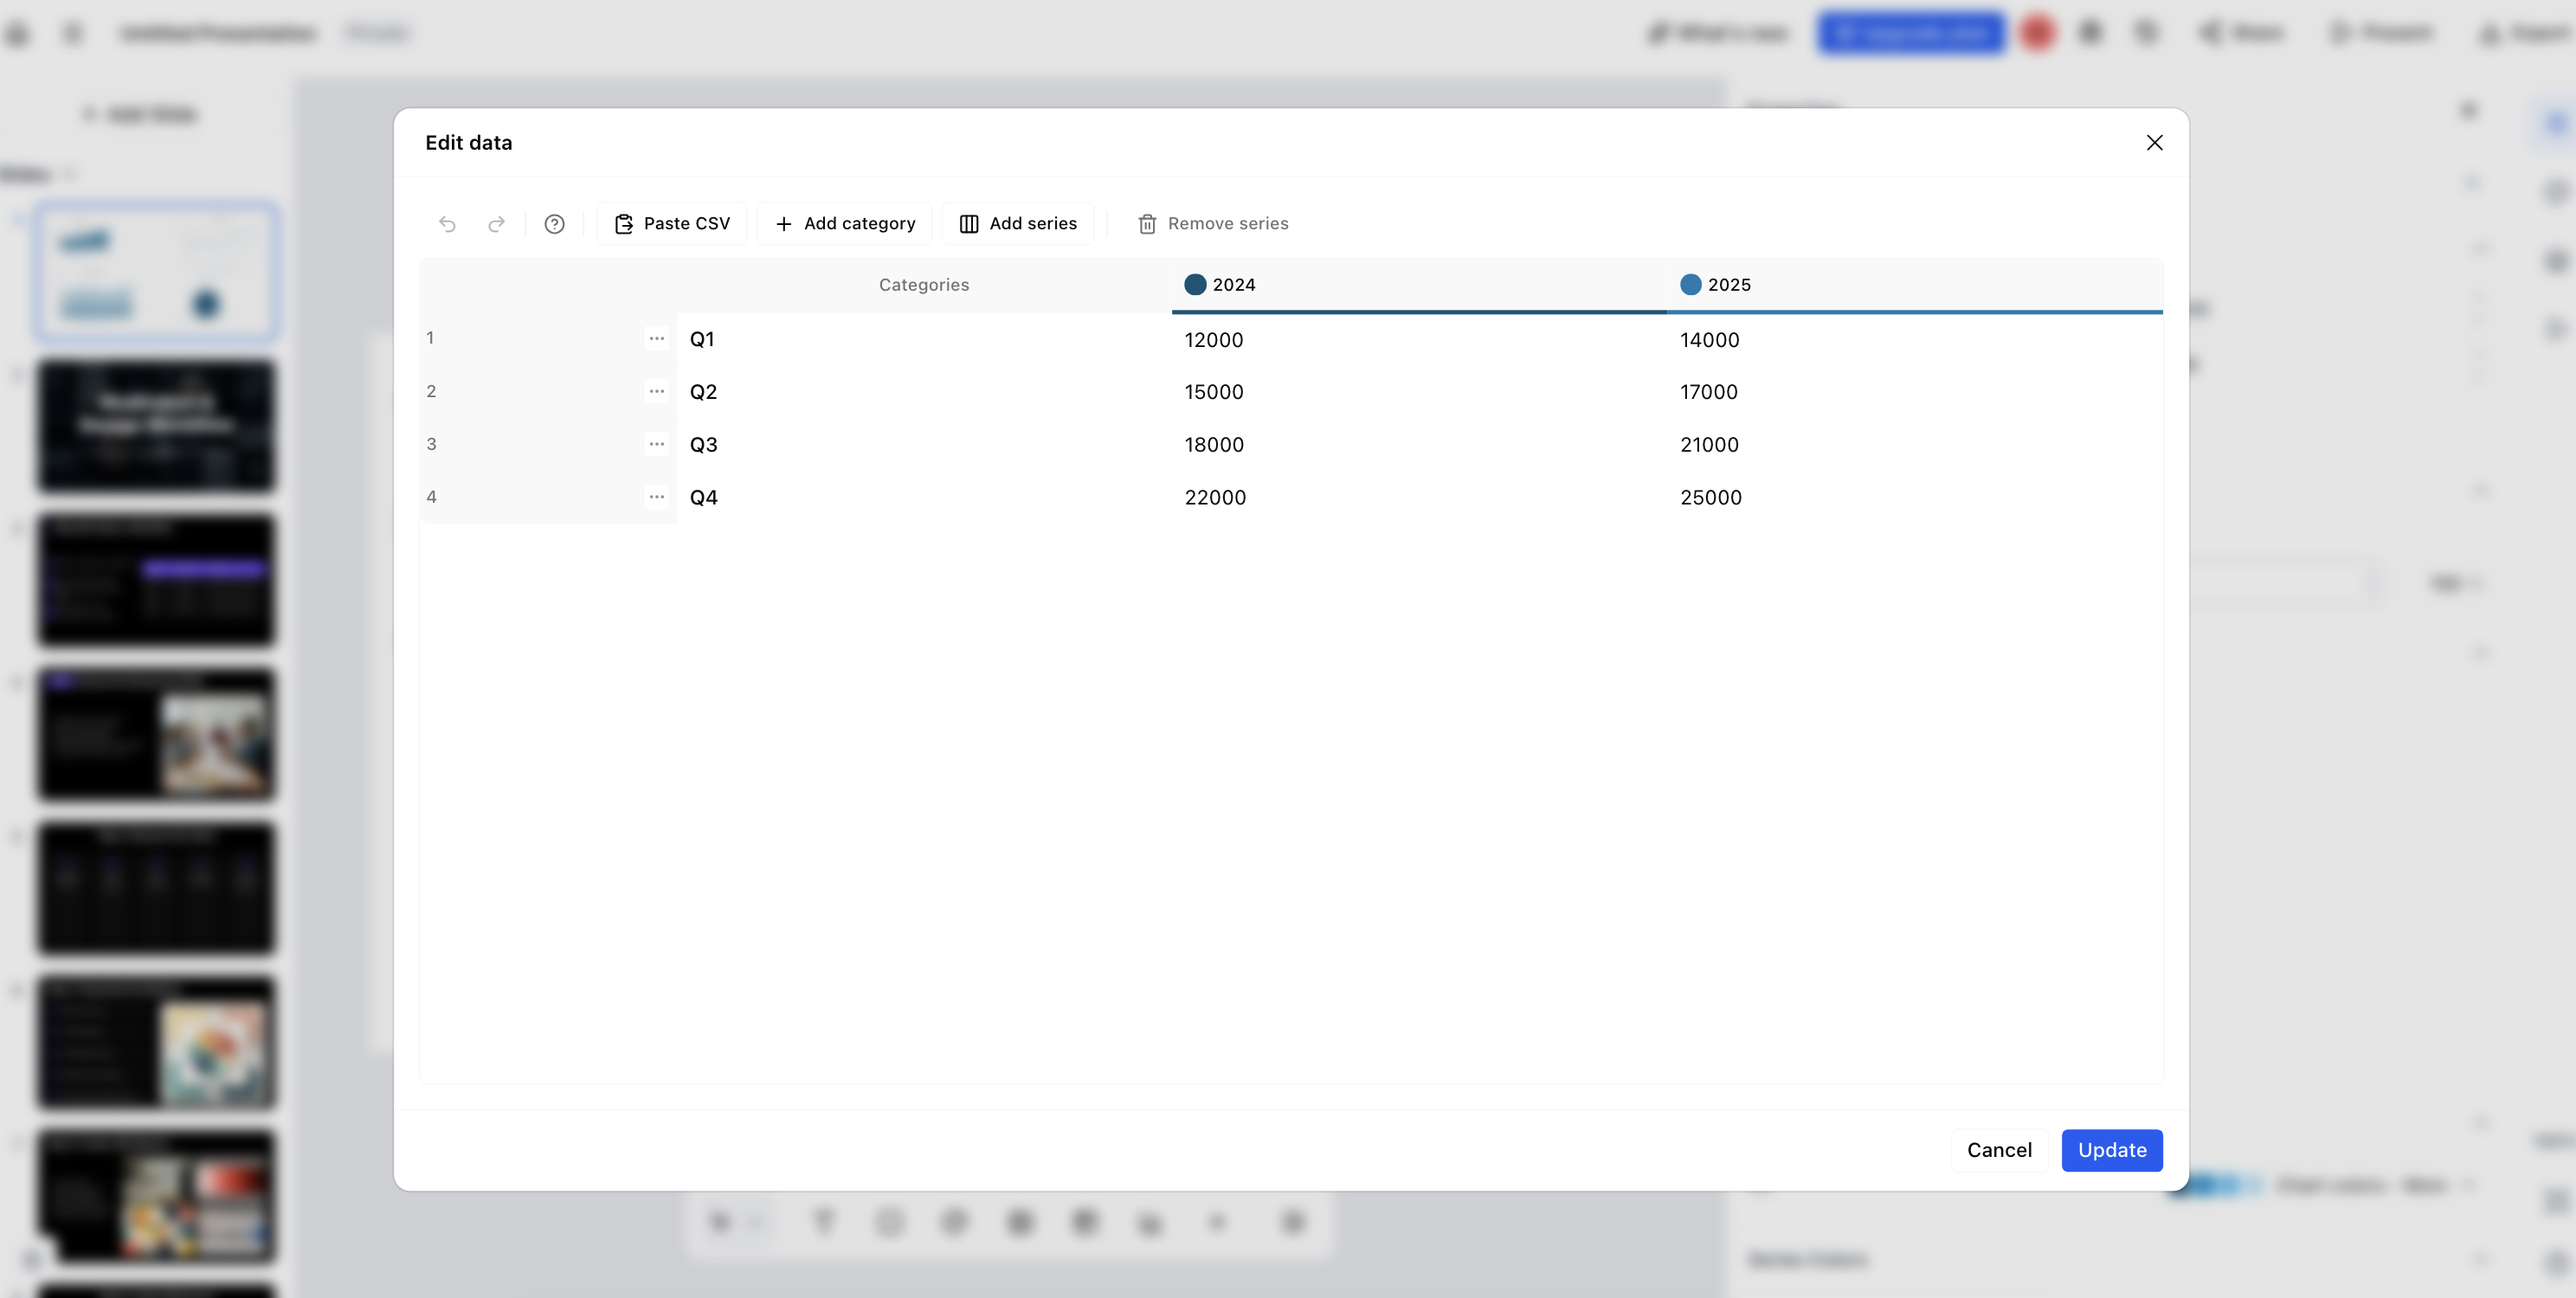
Image cropping
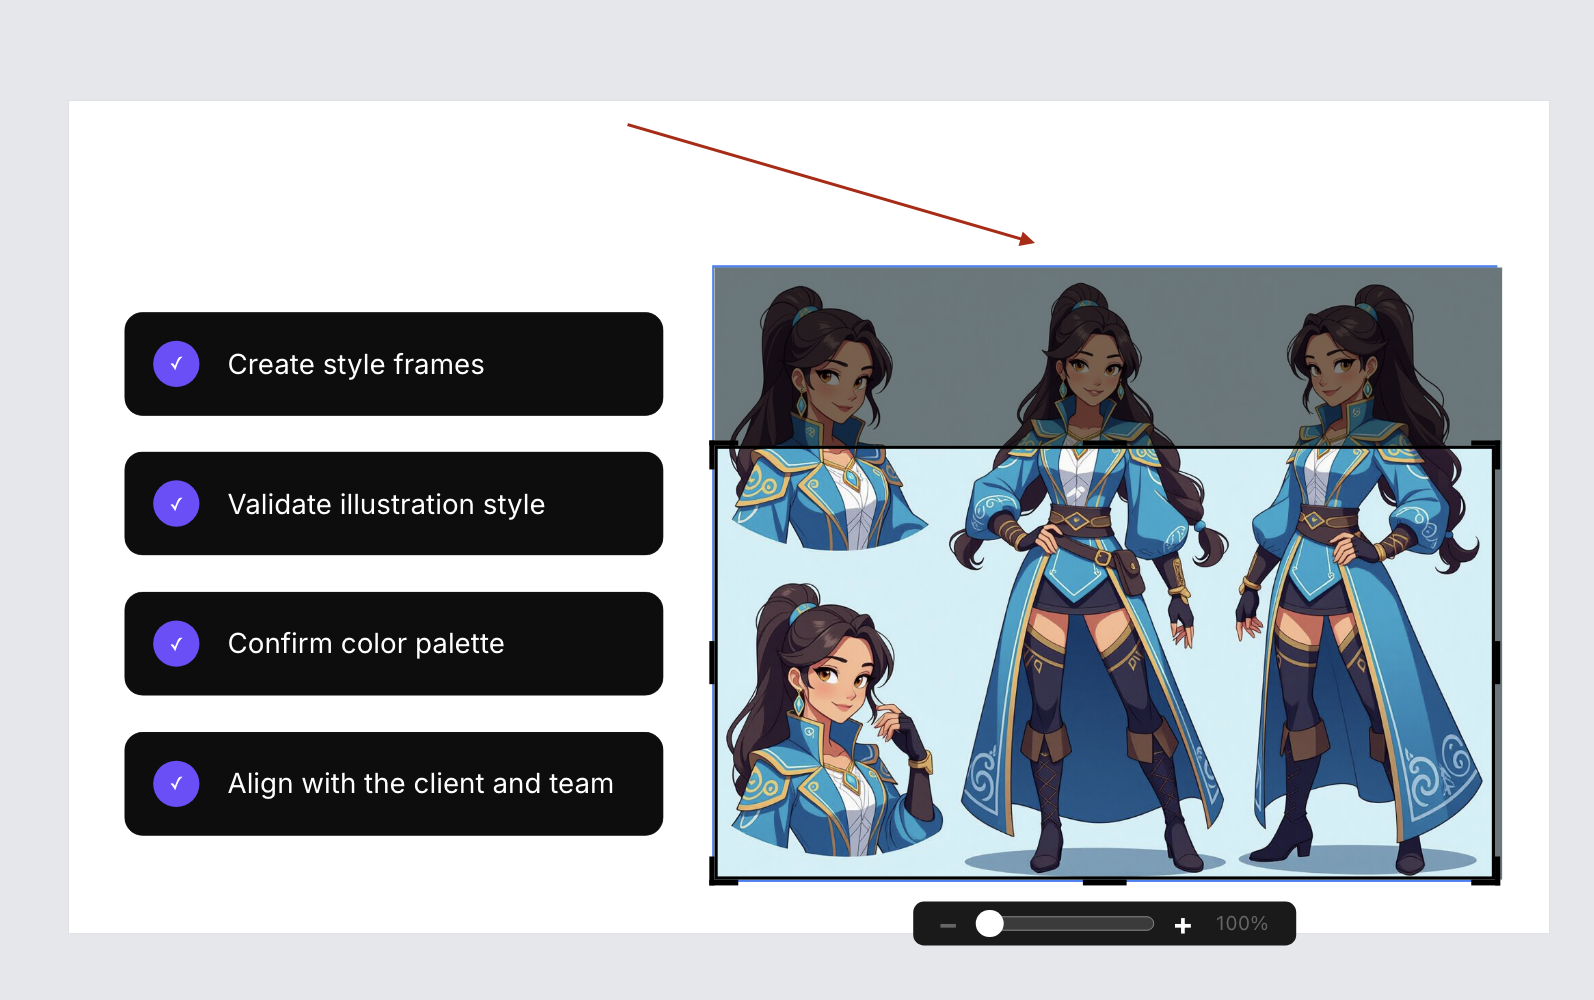
Crop images directly in the editor to frame visuals exactly how you want, without bouncing out to a separate image tool.
Select the image on your slide.
Click the Crop button in the image toolbar.
Drag the crop handles to adjust the crop area.
Click outside the image or press Enter to apply the crop.

Improvements
Smart default colors — new text elements pick sensible colors automatically, so they look right the moment you add them. For example, body text defaults to a dark gray that stays readable on most backgrounds.
Refreshed editor UI for a cleaner, easier-to-navigate workspace. The top header, slide sidebar, main editing area, and right properties panel have been streamlined.