
Many more Add Slide layouts — charts, tables, diagrams, and richer covers
The Add Slide button now opens a much larger layout library, organized into categories. Add a chart, table, diagram, cover, metric, or image slide in one click — each arrives pre-styled to your theme, ready for your content.
What's new
A Charts & data category
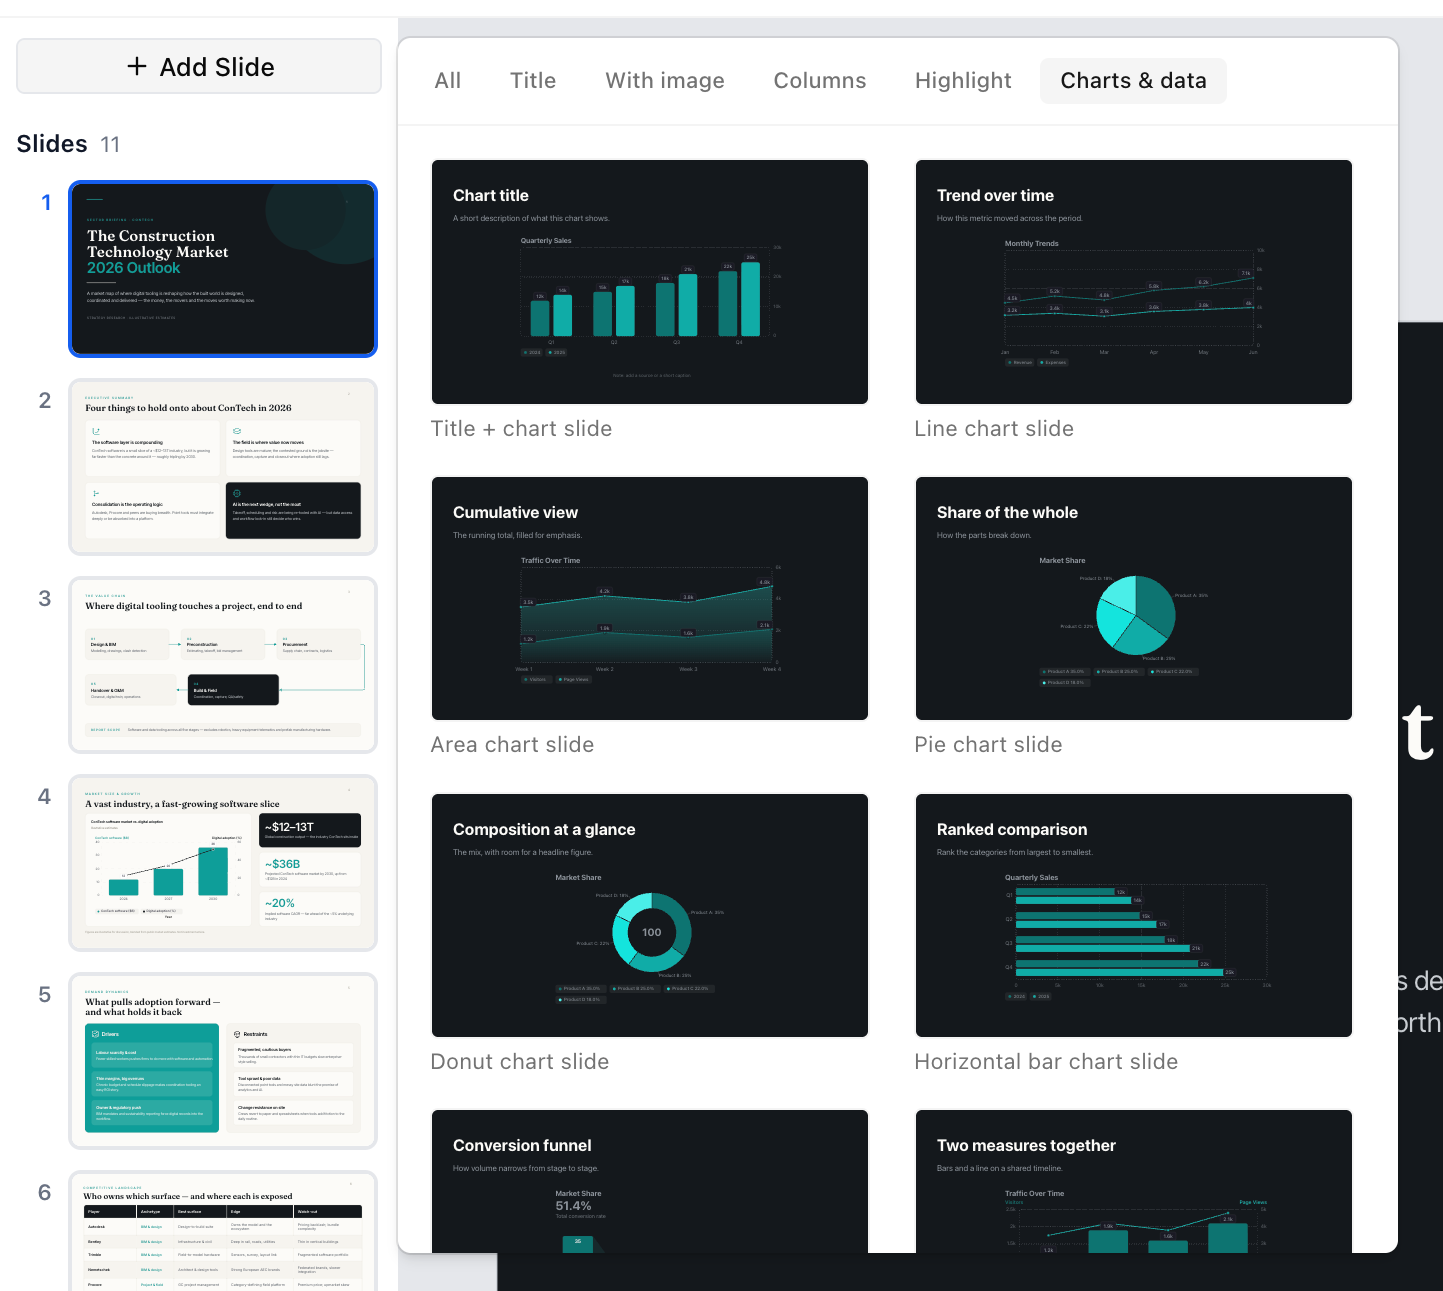
A new Charts & data tab groups every data layout in one place. Add a chart in the type that fits — bar, line, area, pie, donut, funnel, waterfall, scatter, combo, or horizontal bar — or a multi-chart slide with two or three charts, including mixed types. Tables come as a full-width table, a table beside text, or two tables side by side. Diagrams include Venn (two and three circles), concentric circles, a 2×2 matrix, and Gantt, timeline, and process-flow diagrams. Charts and tables take your theme's colors automatically.
Richer covers and section slides
The Title category adds a cover with a kicker label, a cover with an author and date line, a numbered section divider with a large section number, and a closing "Thank you" slide.
More ways to highlight a number
The Highlight category adds a bold statement slide, two- and four-metric slides, and a stat-with-context slide that pairs a big number with a short explanation.
More image and column layouts
The With image category adds two-image, four-image, and six-image grids, image cards with captions, and a team grid with a portrait, name, and role per person. The Columns category adds five columns, numbered steps, two headed columns, four cards, and a feature list.
How to use it
Click Add Slide above the slide thumbnails, pick a category tab, and click a layout to drop it in after your current slide. See Add a slide from a layout.