
Add a slide from a layout
Updated 2 months ago
Add a ready-made slide — a cover, text layout, image grid, chart, table, or diagram — from the Add Slide button in the editor. Each layout arrives with placeholder content already styled to your theme, so you replace the content instead of building the slide from scratch.
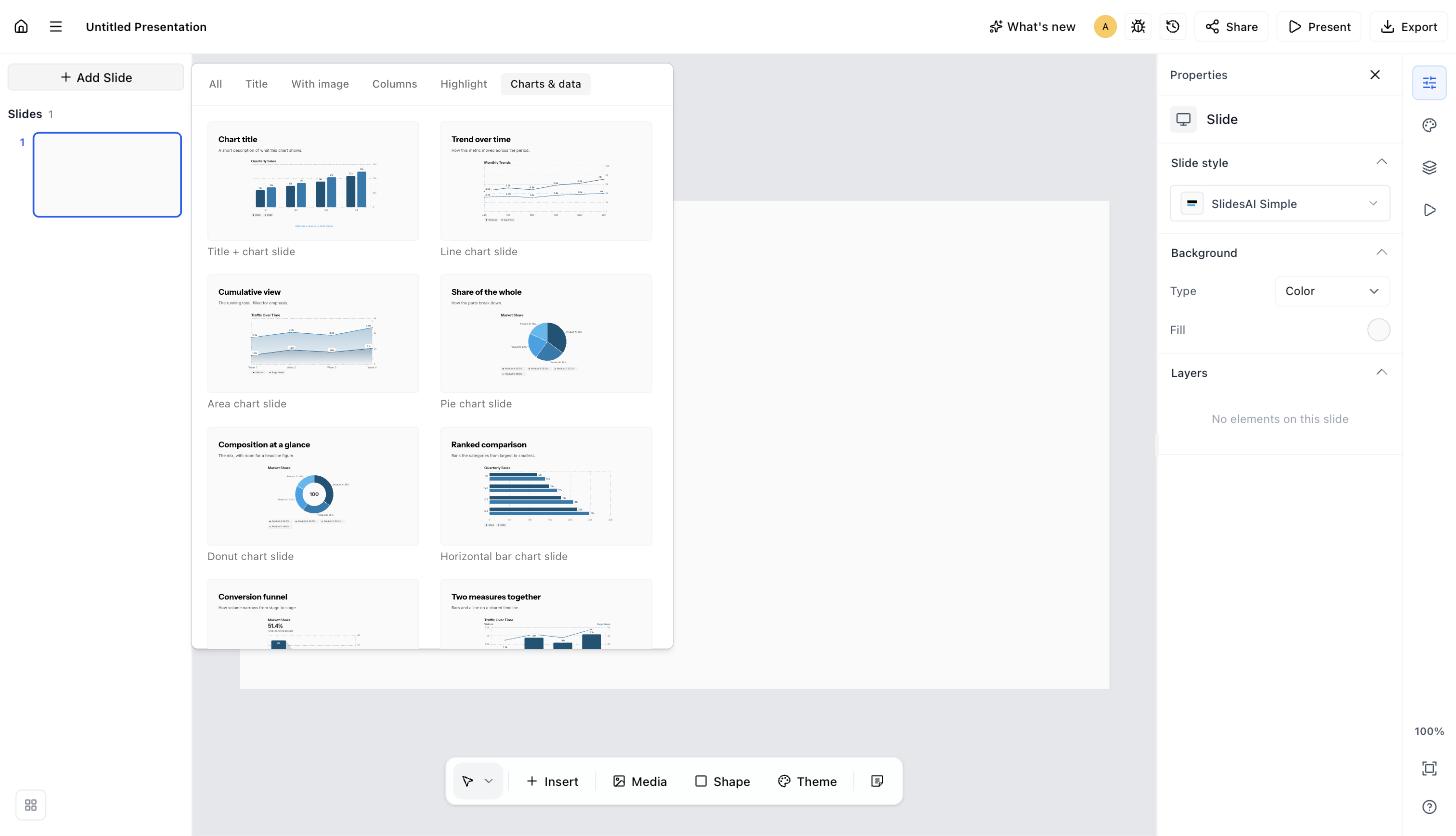
Add a slide
Open your presentation in the Platform editor. New slides are added after the slide you're currently on, so select that slide first.
Click Add Slide at the top of the slide thumbnails on the left.
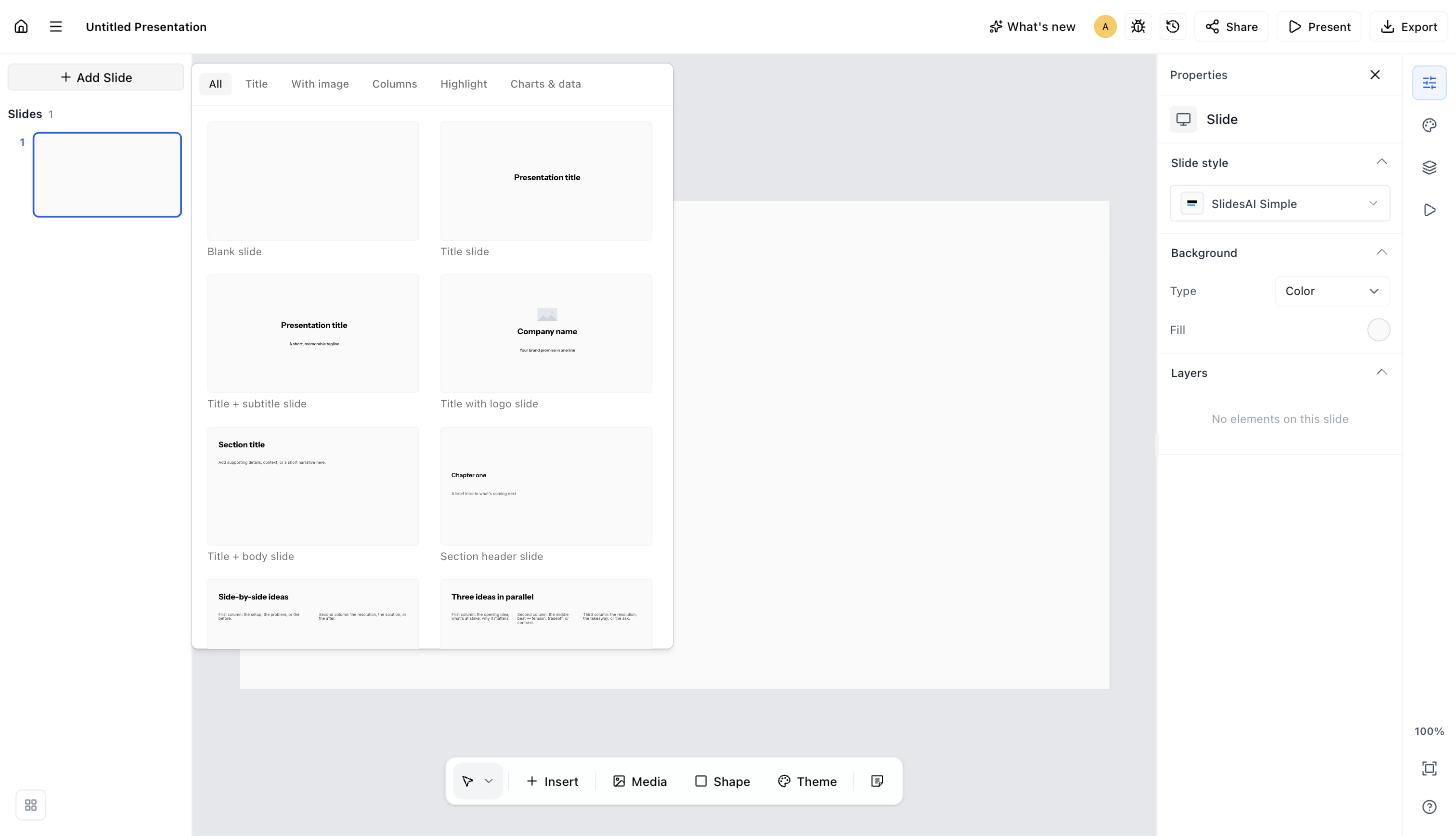
Browse layouts by category with the tabs along the top: All, Title, With image, Columns, Highlight, and Charts & data.
Click a layout. The new slide is inserted after the current slide, filled with placeholder text and sample content in your theme's colors and fonts.
Replace the placeholder text. For a chart, table, or diagram, double-click it to edit the data or source with its own controls.
Charts and tables pick up your theme's colors automatically, so a slide you add matches the rest of the deck. Change the whole deck's theme later and these layouts recolor with it.
Layout categories
Every layout lives under All and under one or more category tabs. Use the tabs to narrow to the kind of slide you need.
Category | What's inside |
|---|---|
Title | Covers and section dividers — title and subtitle, a kicker label, an author and date line, a numbered section, and a closing "Thank you" slide. |
With image | Image-led layouts — image beside text, two images, four- and six-image grids, image cards with captions, and a team grid. |
Columns | Text in parallel — two to five columns, numbered steps, headed columns, cards, a comparison, an agenda, and a feature list. |
Highlight | One thing, emphasized — a big number, two or four metrics, a stat with context, a bold statement, and a quote. |
Charts & data | Charts (bar, line, area, pie, donut, funnel, waterfall, scatter, combo, horizontal bar), multi-chart slides, tables, and diagrams — Venn, concentric circles, a 2×2 matrix, and Gantt, timeline, and process-flow diagrams. |
Examples
Every example starts the same way: click Add Slide, open a category tab, and click the layout.
Add a chart — open the Charts & data tab and pick the chart type you want: a line for a trend, a pie or donut for a split, a funnel for conversion. Double-click the chart to edit its data.
Add a table — open the Charts & data tab and pick a full-width table or a table beside text, then double-click a cell to fill it in.
Add a schedule — open the Charts & data tab and pick the Gantt or timeline layout for phases and milestones.
Open the deck — open the Title tab and pick the cover with a kicker, or with an author and date line.
Break between sections — open the Title tab and pick the numbered section, with a large section number.
Compare options — open the Columns tab for two headed columns or a comparison, or Charts & data for a table beside text.
Present a result — open the Highlight tab and pick a big number, a two- or four-metric layout, or a stat with context.
Introduce the team — open the With image tab and pick the team grid, with a portrait, name, and role per person.
Close the deck — open the Title tab and pick the "Thank you" layout.
The Charts & data tab, for example, holds every chart type, tables, and diagrams together:
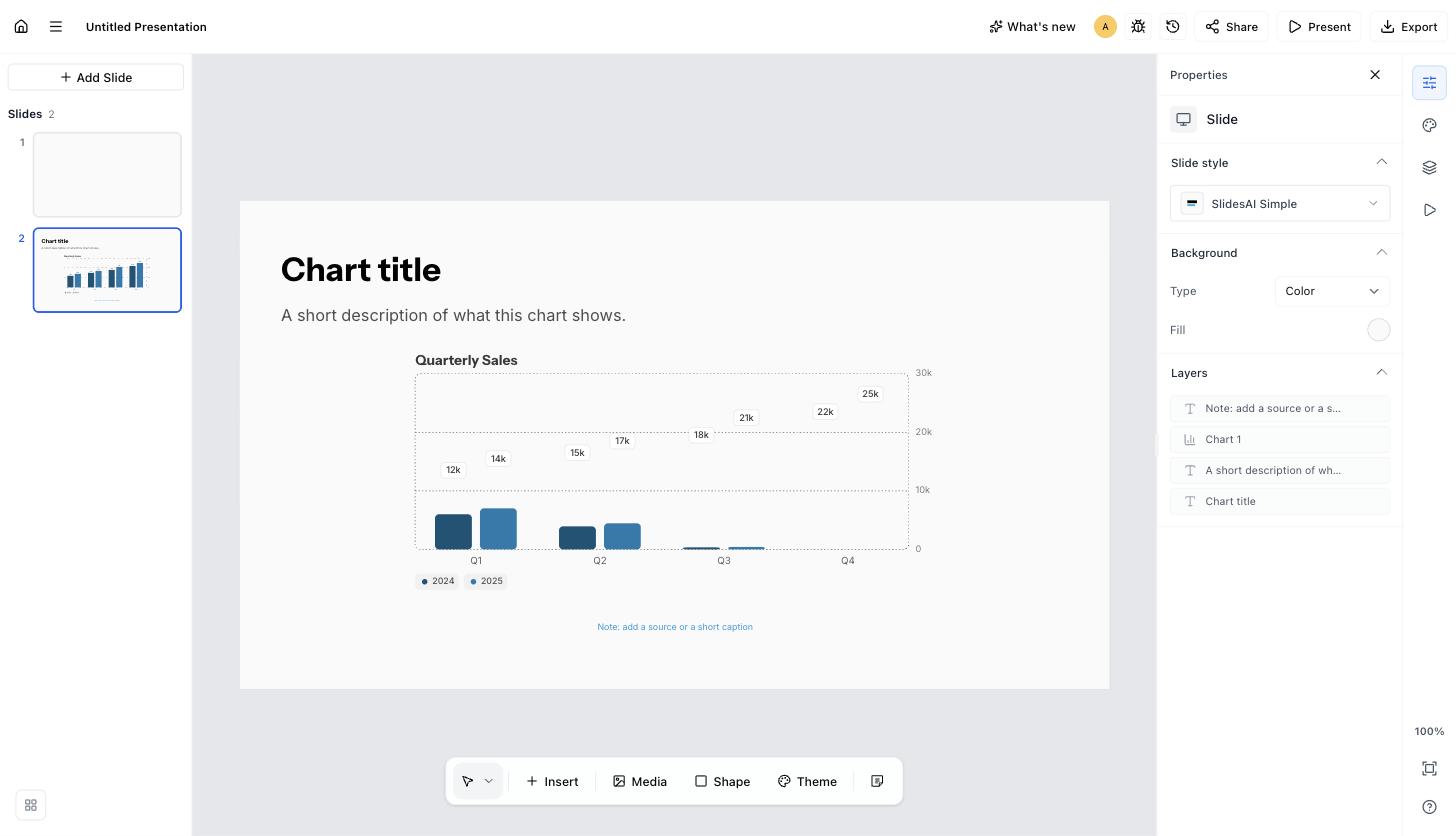
Picking the Title + chart layout adds a titled bar chart with a description line and a caption, in your theme — retype the title and edit the data:
To change the style of a slide you already have instead of adding a new one, see Change themes and layouts.