New charting engine, world maps, Mermaid diagrams, and reliable links
August brings a rebuilt charting engine, world map charts, Mermaid diagrams that follow your theme, internal slide link and external link support, and a cleaner bottom toolbar. Code blocks also render fully instead of clipping.
What's new
A more powerful chart editor
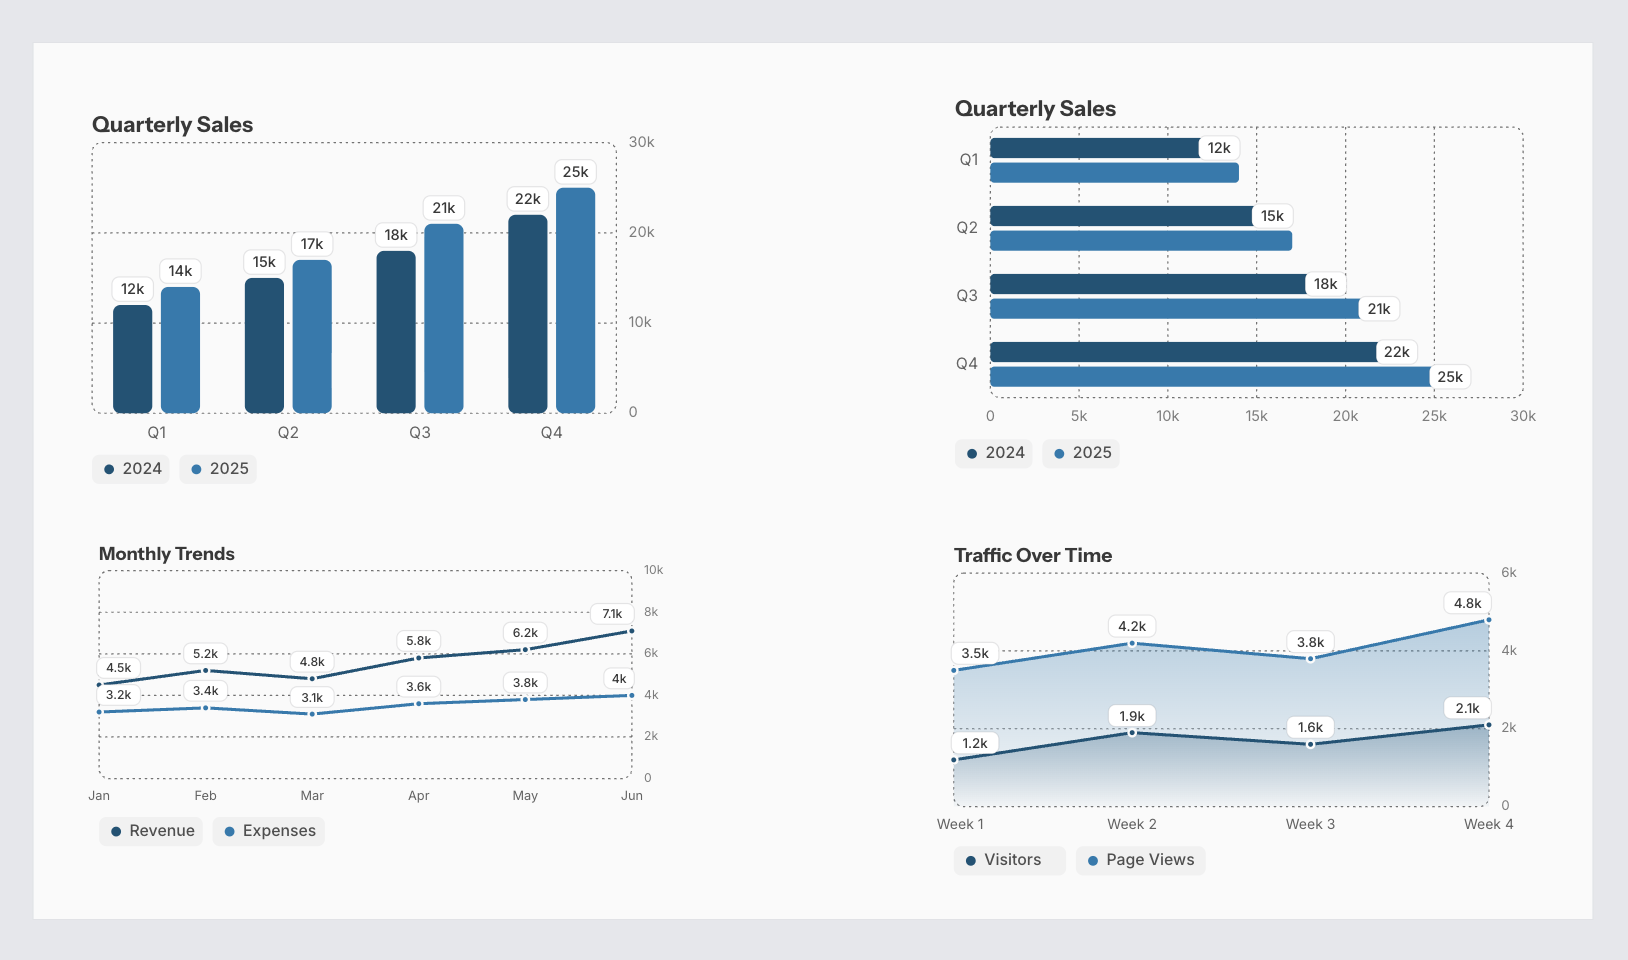
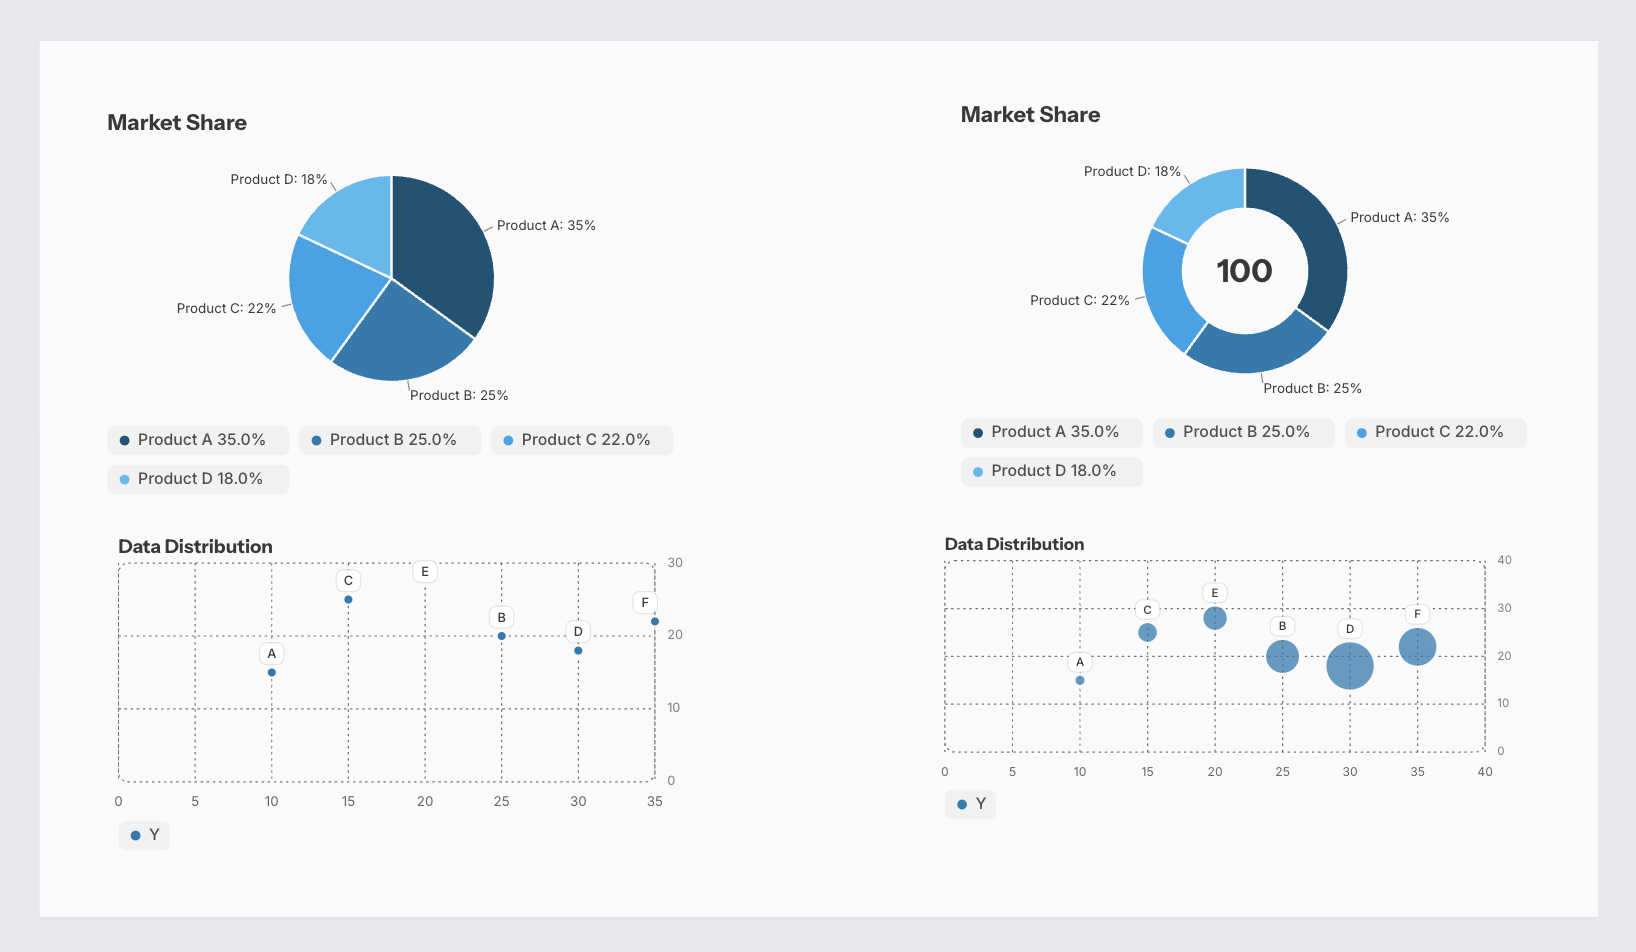
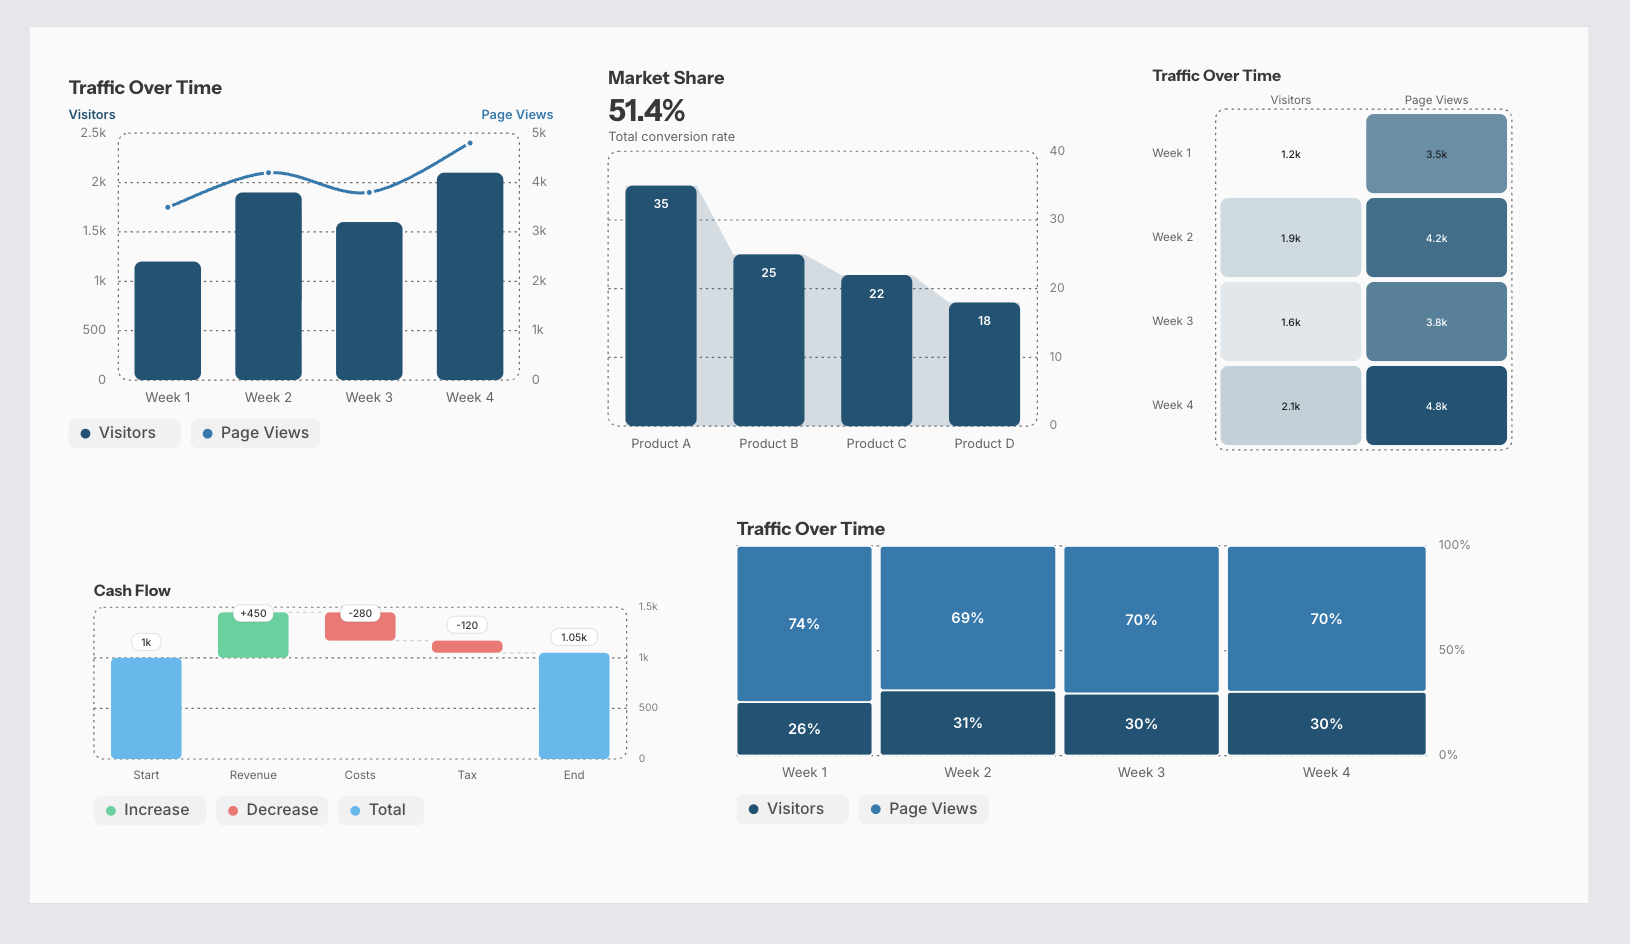
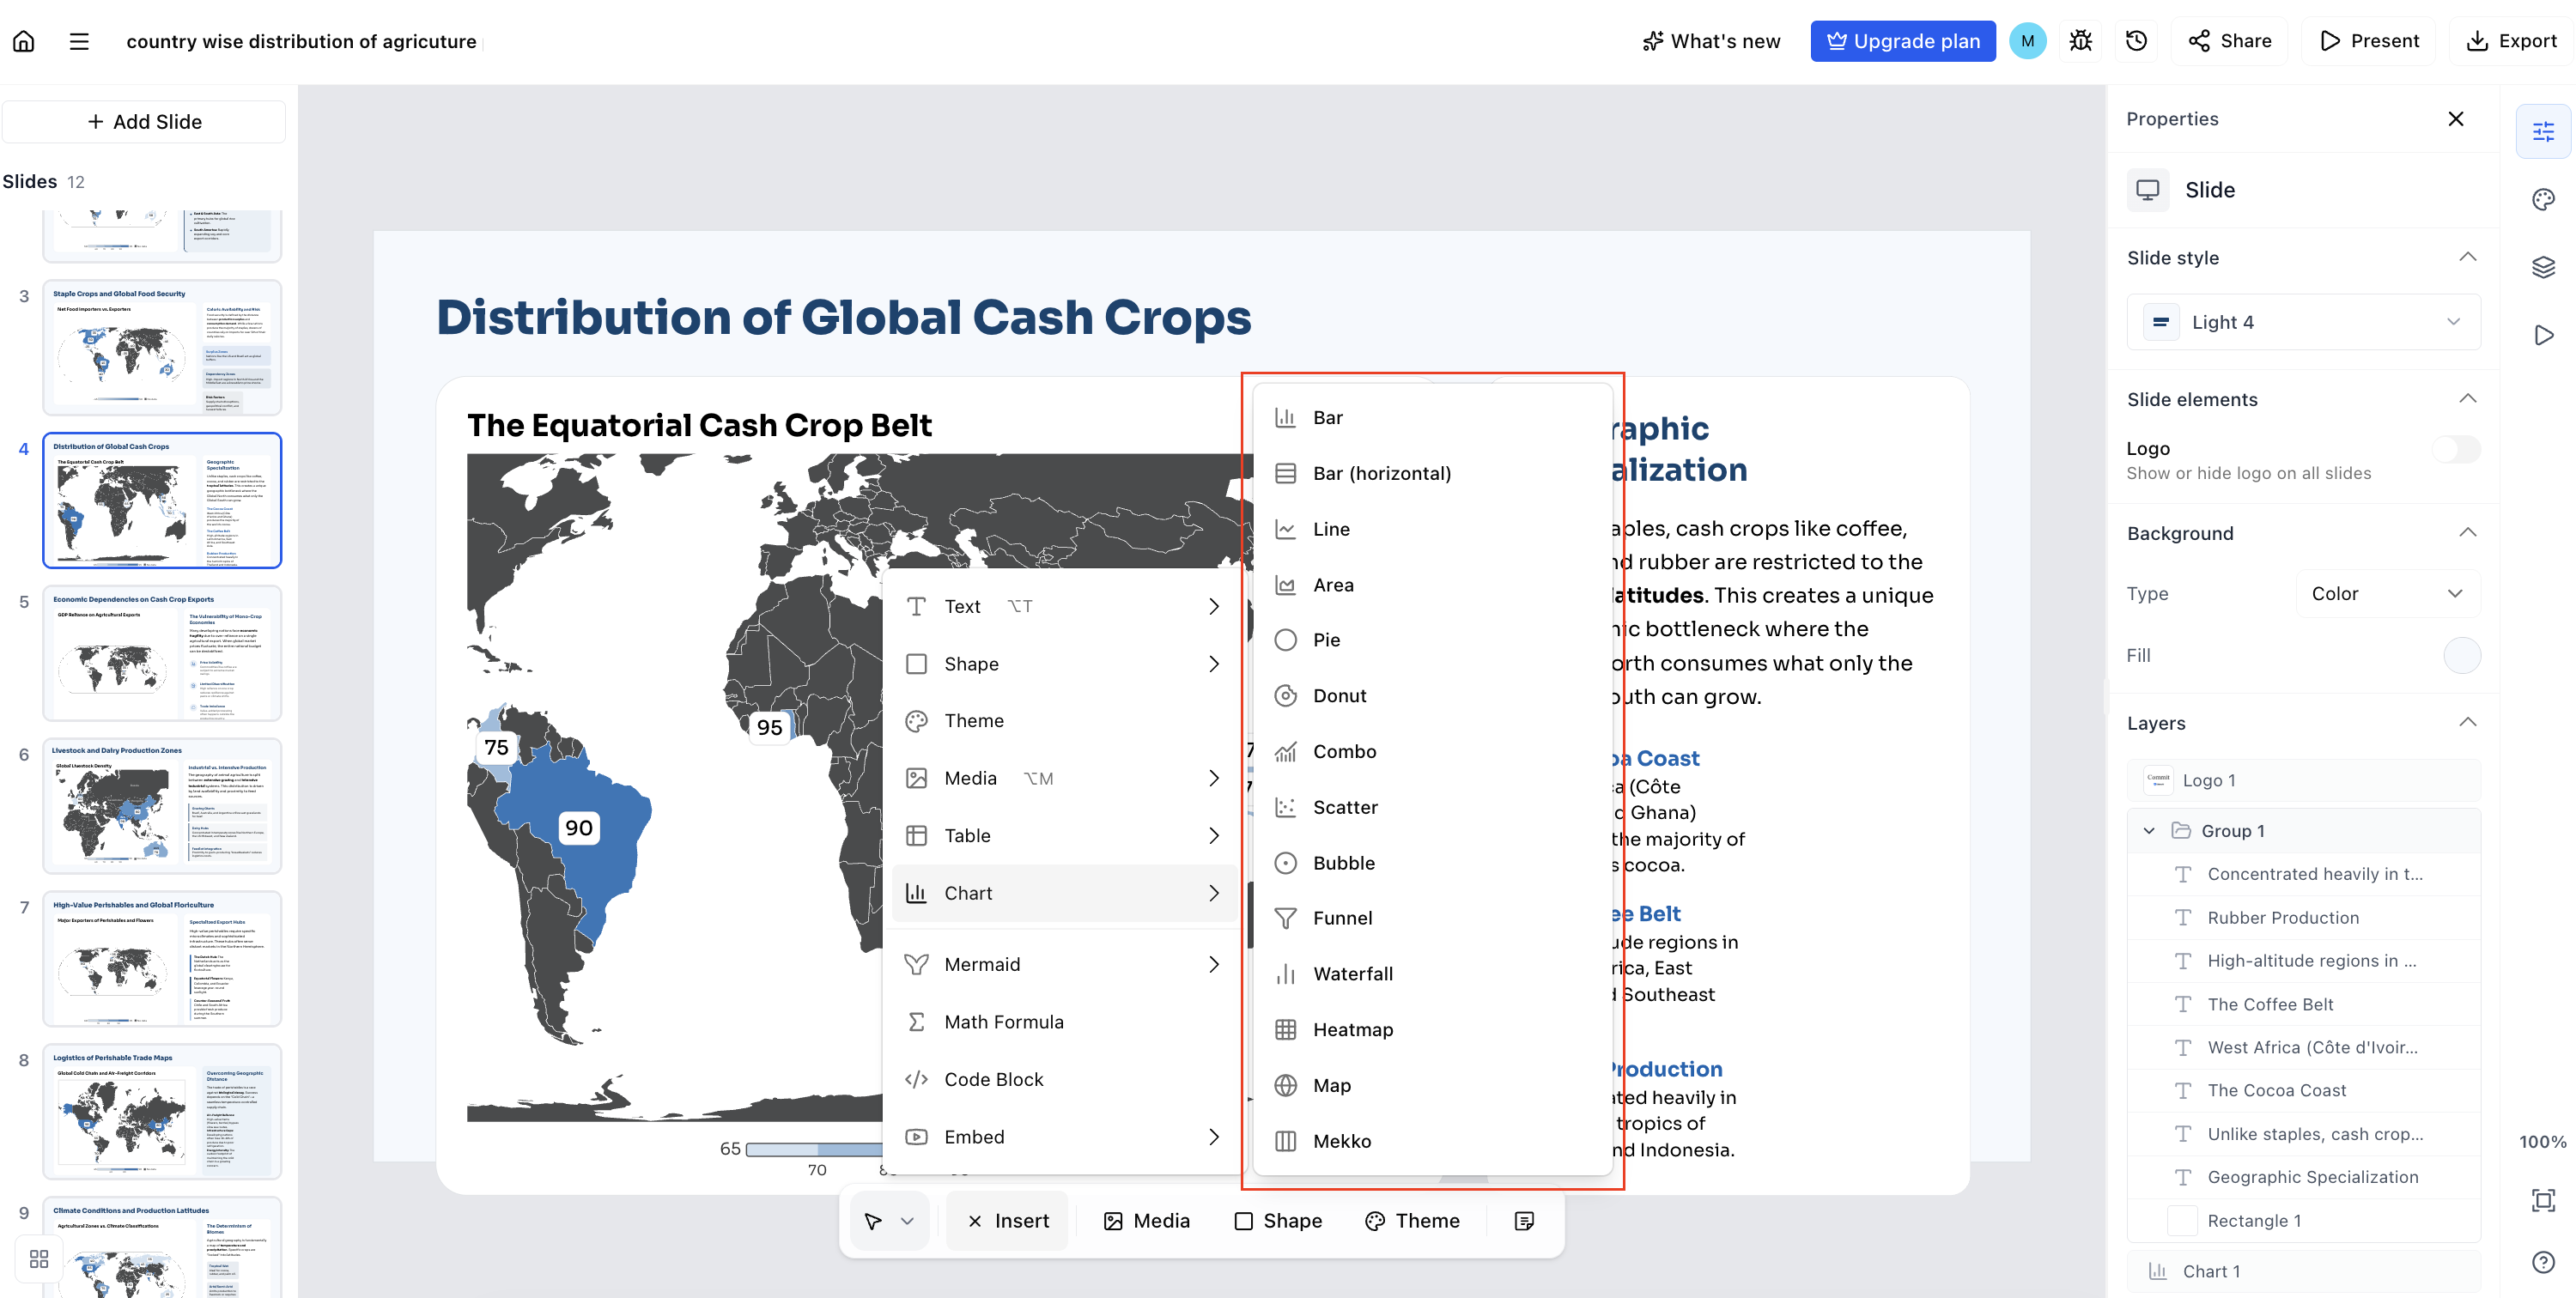
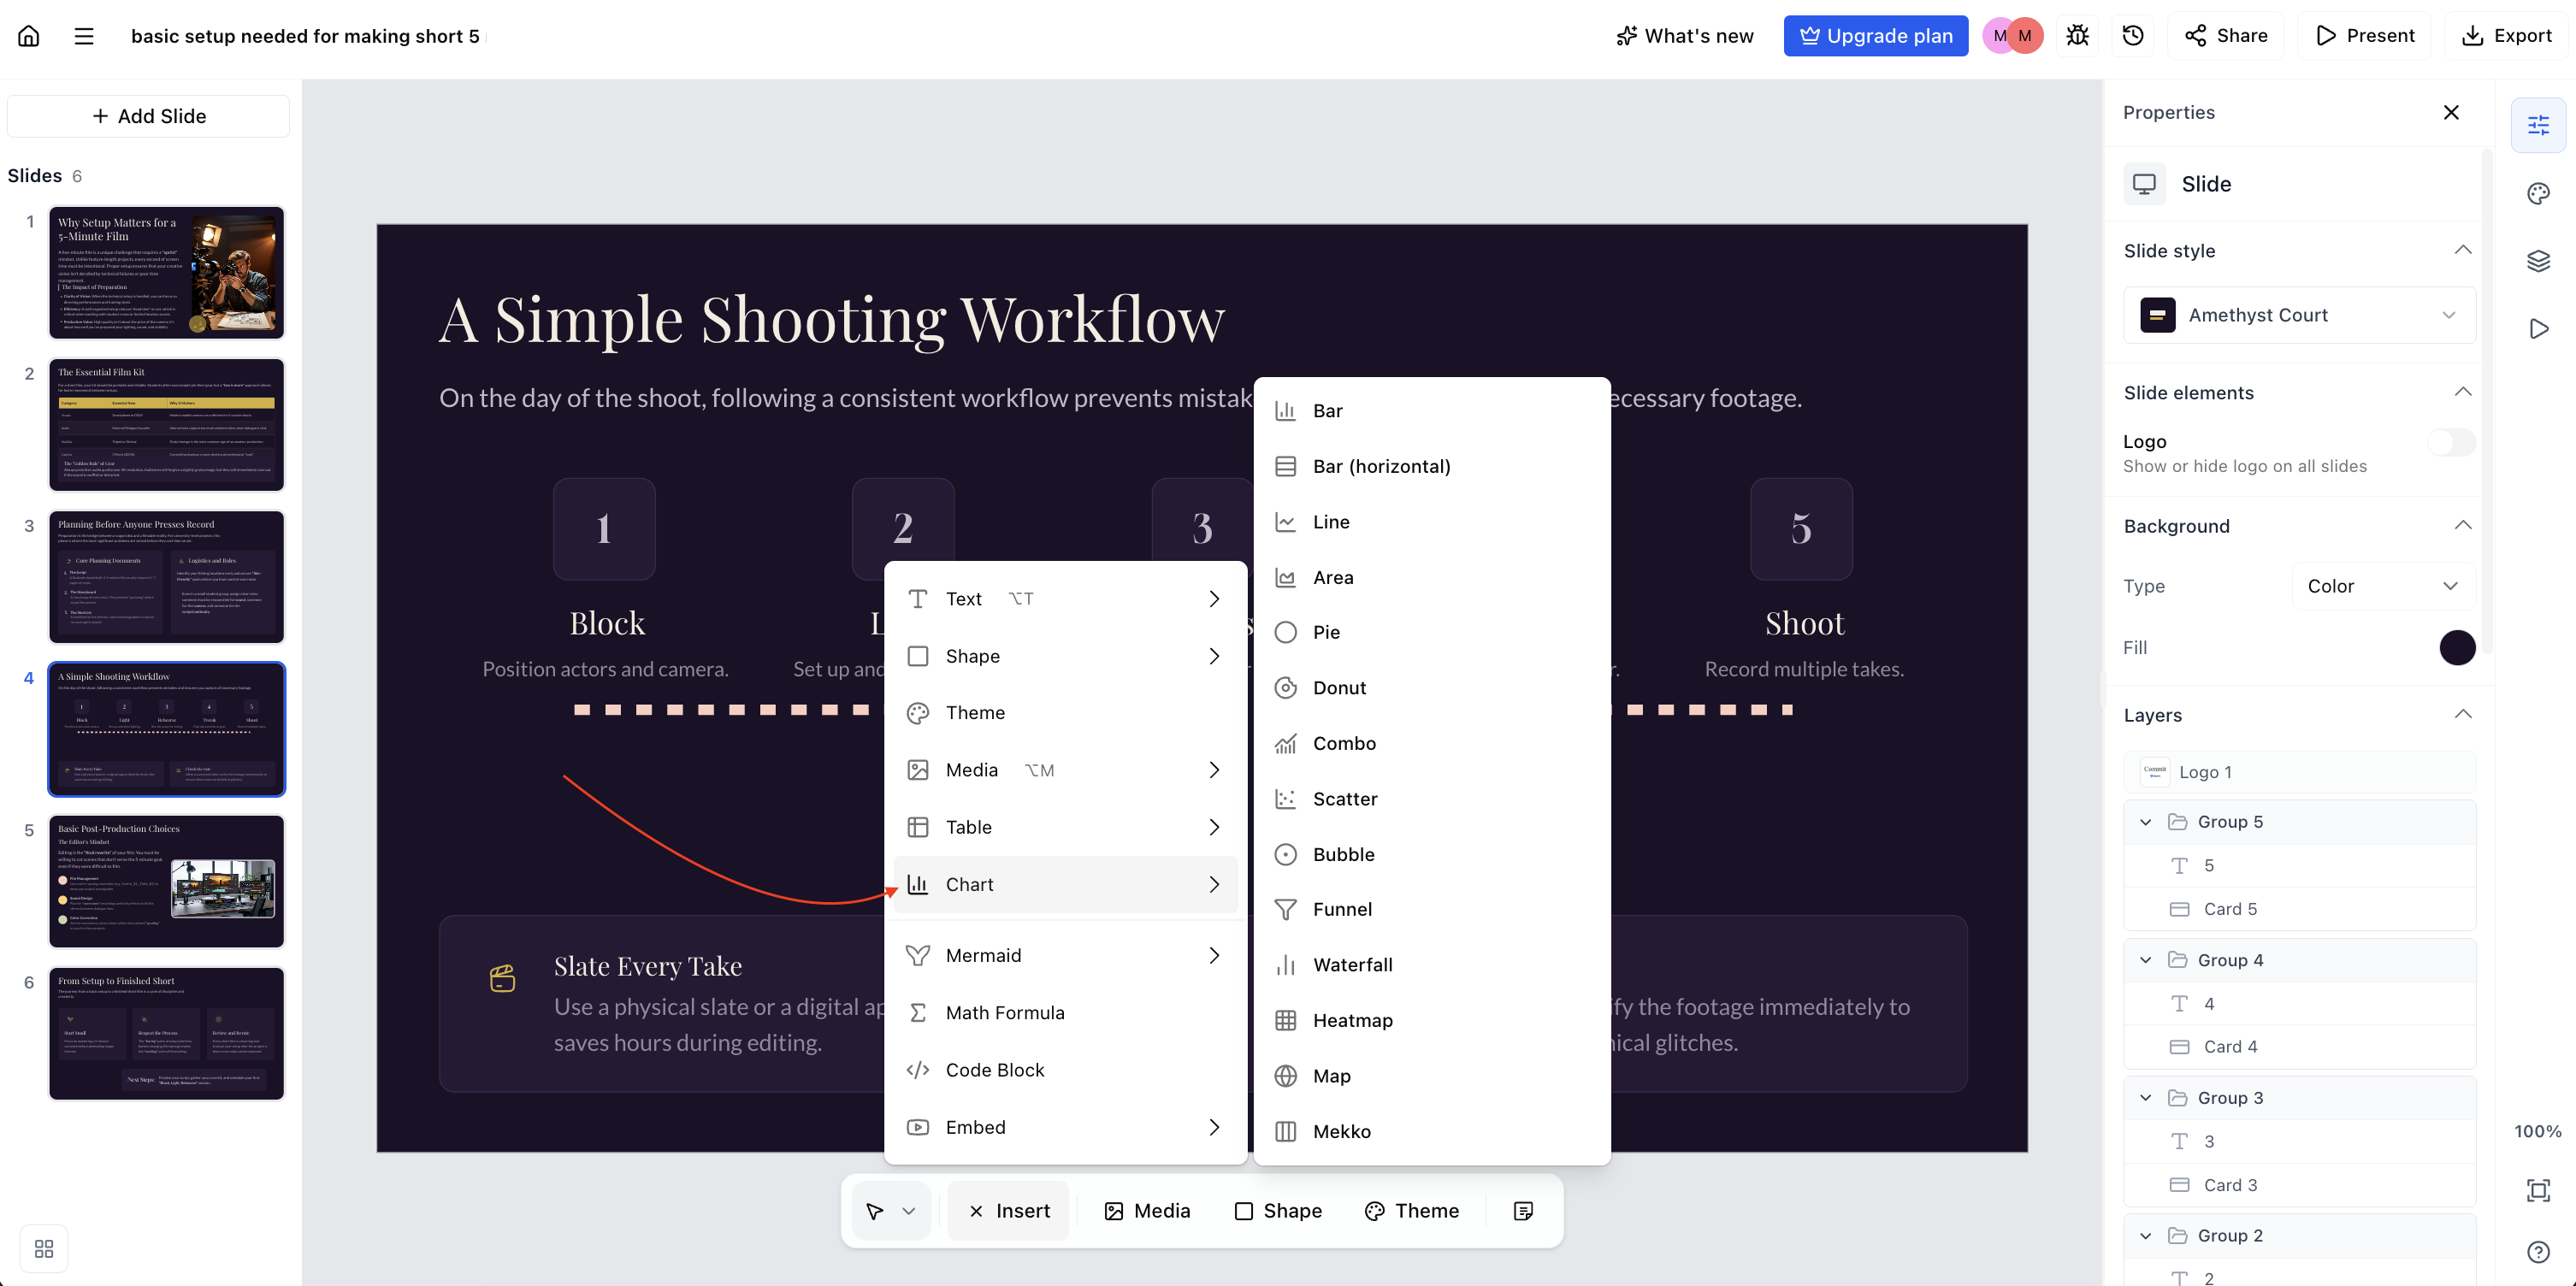
The chart editor now offers more chart types alongside bar, line, area, pie, and donut — including horizontal bar, combo, scatter, bubble, funnel, waterfall, heatmap, and Mekko. Edit data in a spreadsheet-style grid, and add arrows, text notes, stickers, highlights, tooltips, and difference callouts with the annotation tools. See Charts: types, data, annotations and controls.
Annotate charts
The Annotate tab holds six on-chart annotation tools. Two of them — Arrow and Text — work on every chart type; the other four are anchored to data points and are only available on bar (vertical), line, area (not 100% or stacked), combo with a bar series, funnel, waterfall, and mekko charts.
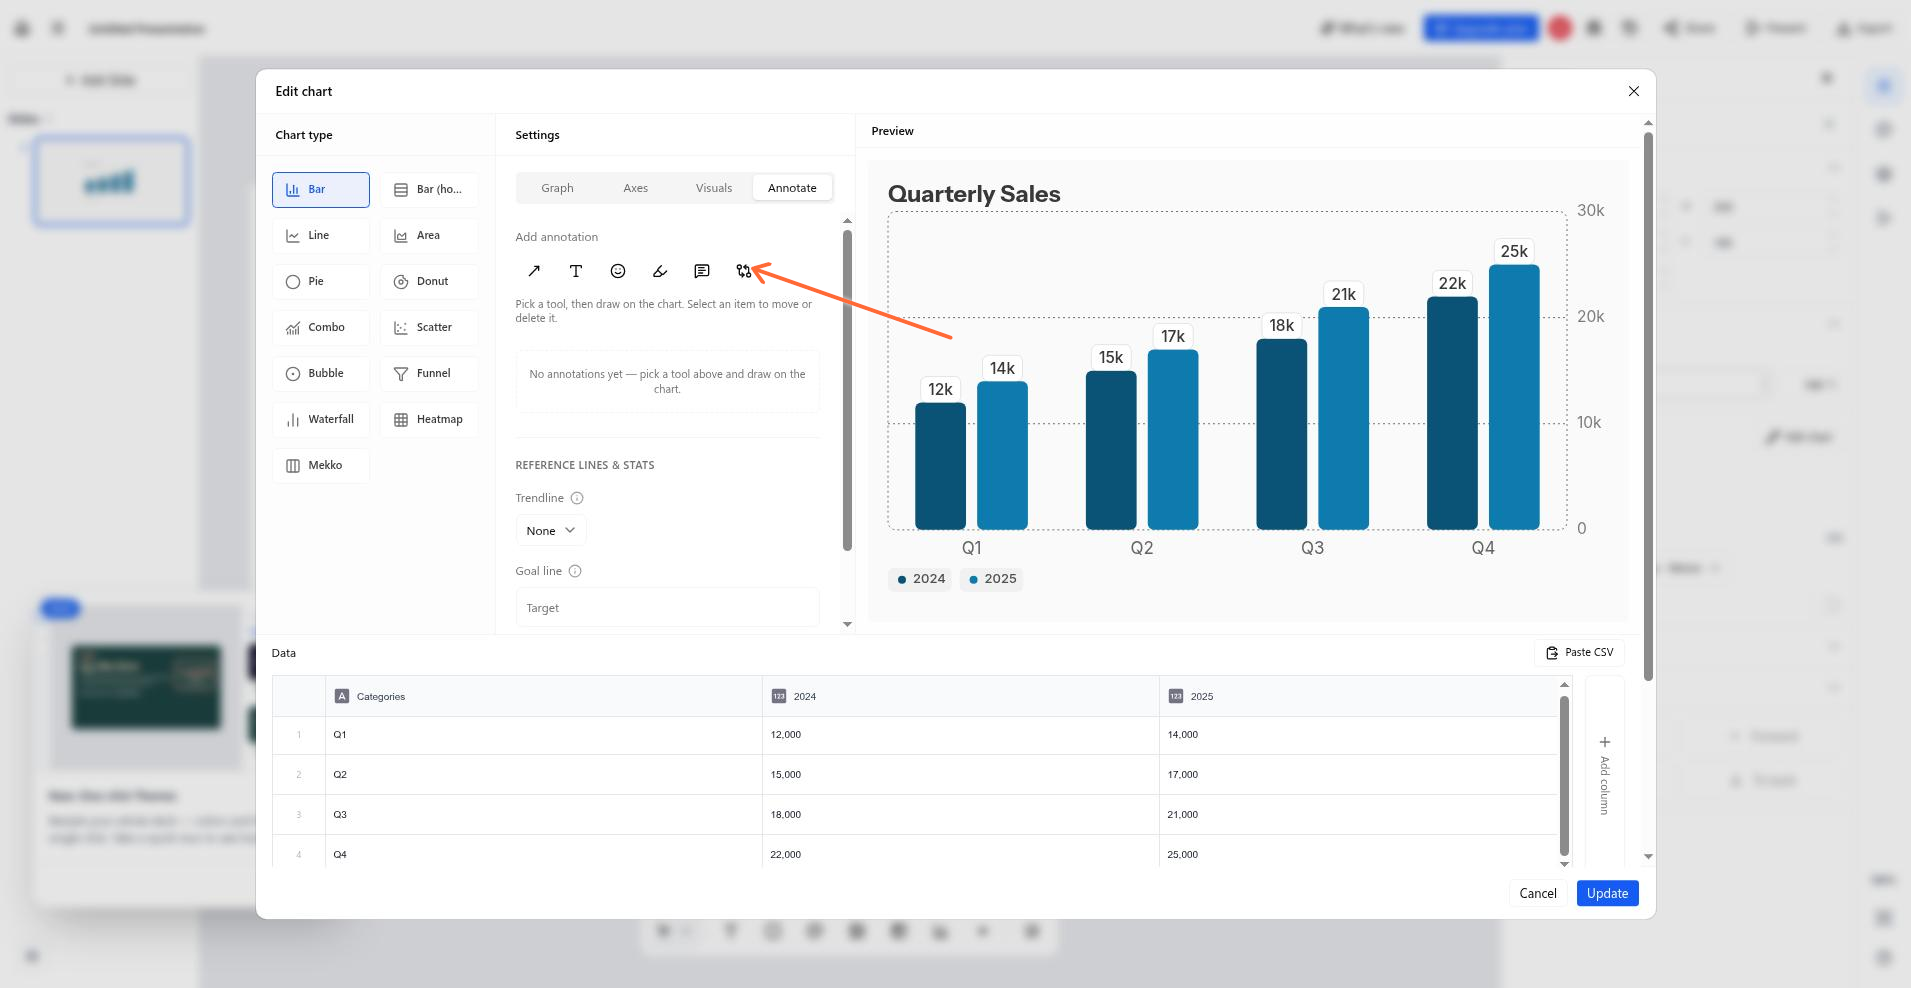
The Annotate tab's toolbar.
Tool | What it does | Where it's allowed |
|---|---|---|
Arrow | Drag on the chart to draw an arrow. Set thickness (thin, medium, thick), dashed style, start and end heads, and color. | All types |
Text | Click to place a note. Set width, color, and background (faded, solid, or none). | All types |
Sticker | Click a data point to drop an emoji. Set size (small, medium, large). | Anchored types |
Highlight | Click a data point to spotlight it, with scope of the data point, the whole series, or the whole category. | Anchored types |
Tooltip | Click a data point to pin a text callout to it. | Anchored types |
Difference | Click two data points to bridge them with a labelled arrow. Label mode: absolute change, percent change, or proportion. | Anchored types |
Annotations follow keep-data, hide-render: switching to a type that can't anchor them hides them with an in-panel notice but keeps them in the document, and switching back restores them. Any rendered annotation makes the chart export to PowerPoint as an image.
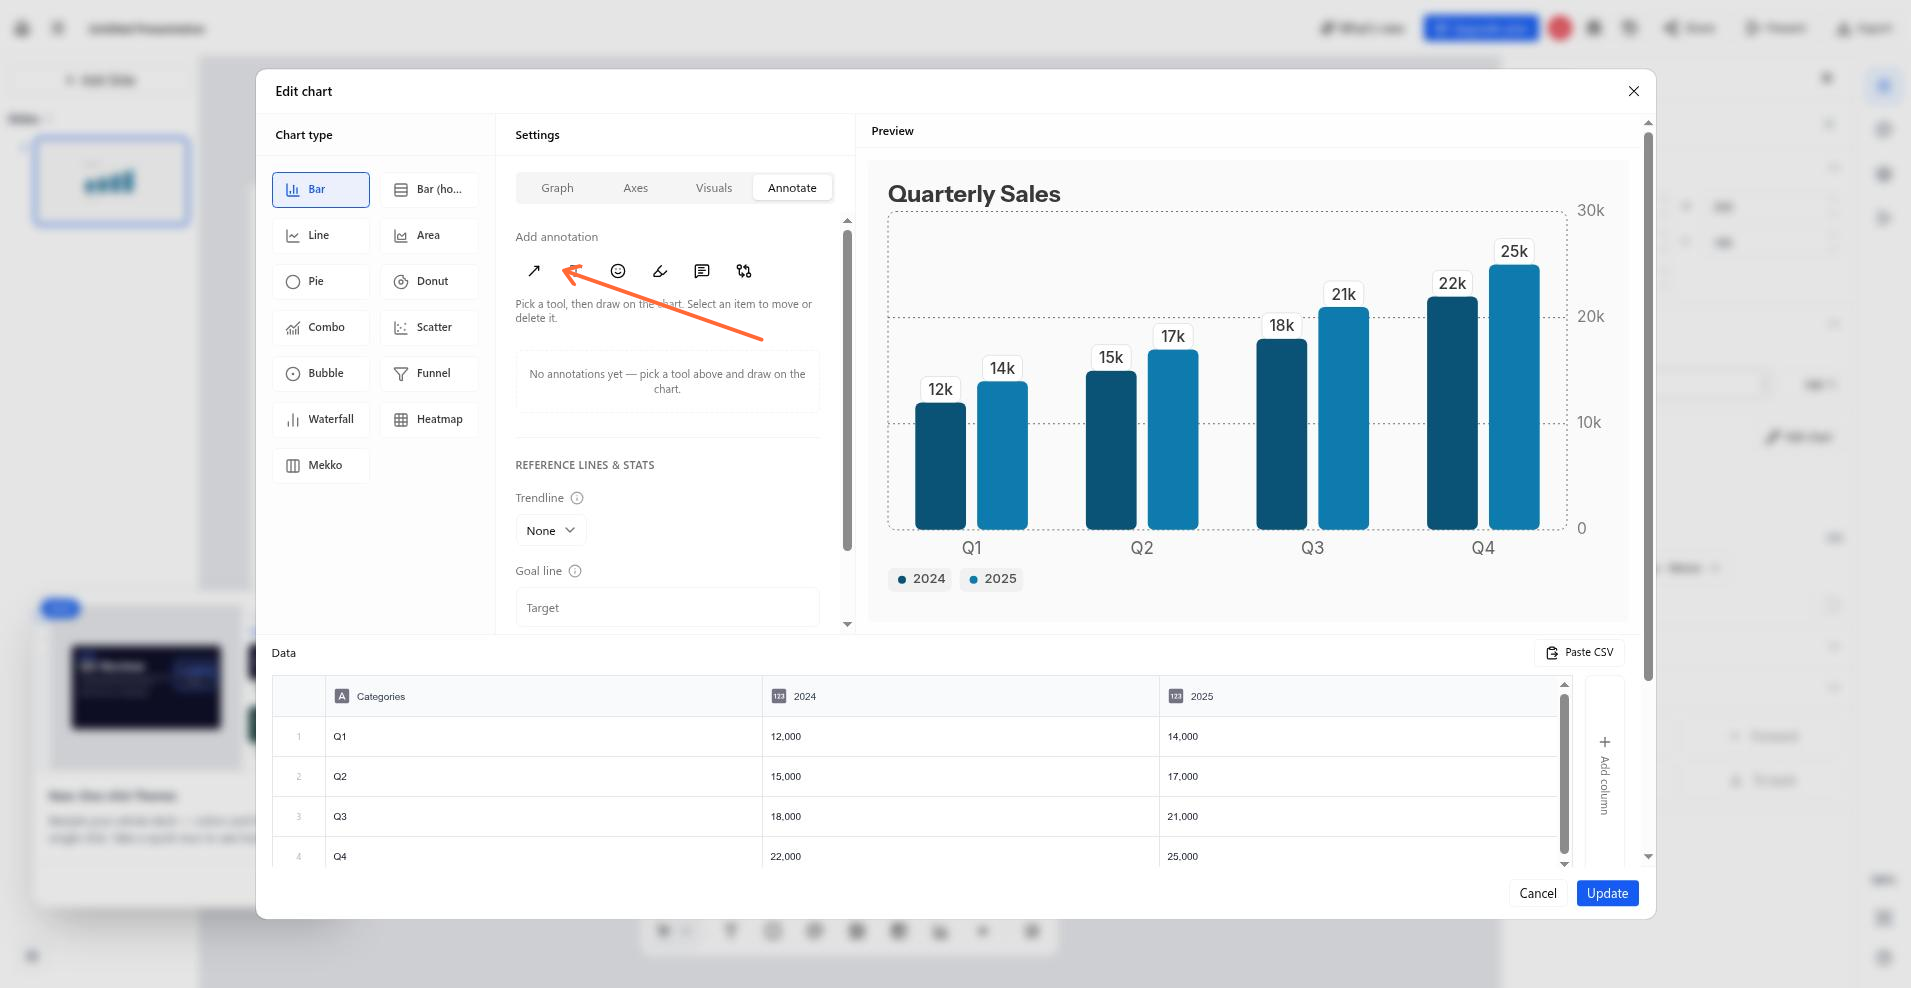
Select the Arrow tool, then drag on the chart to draw an arrow.
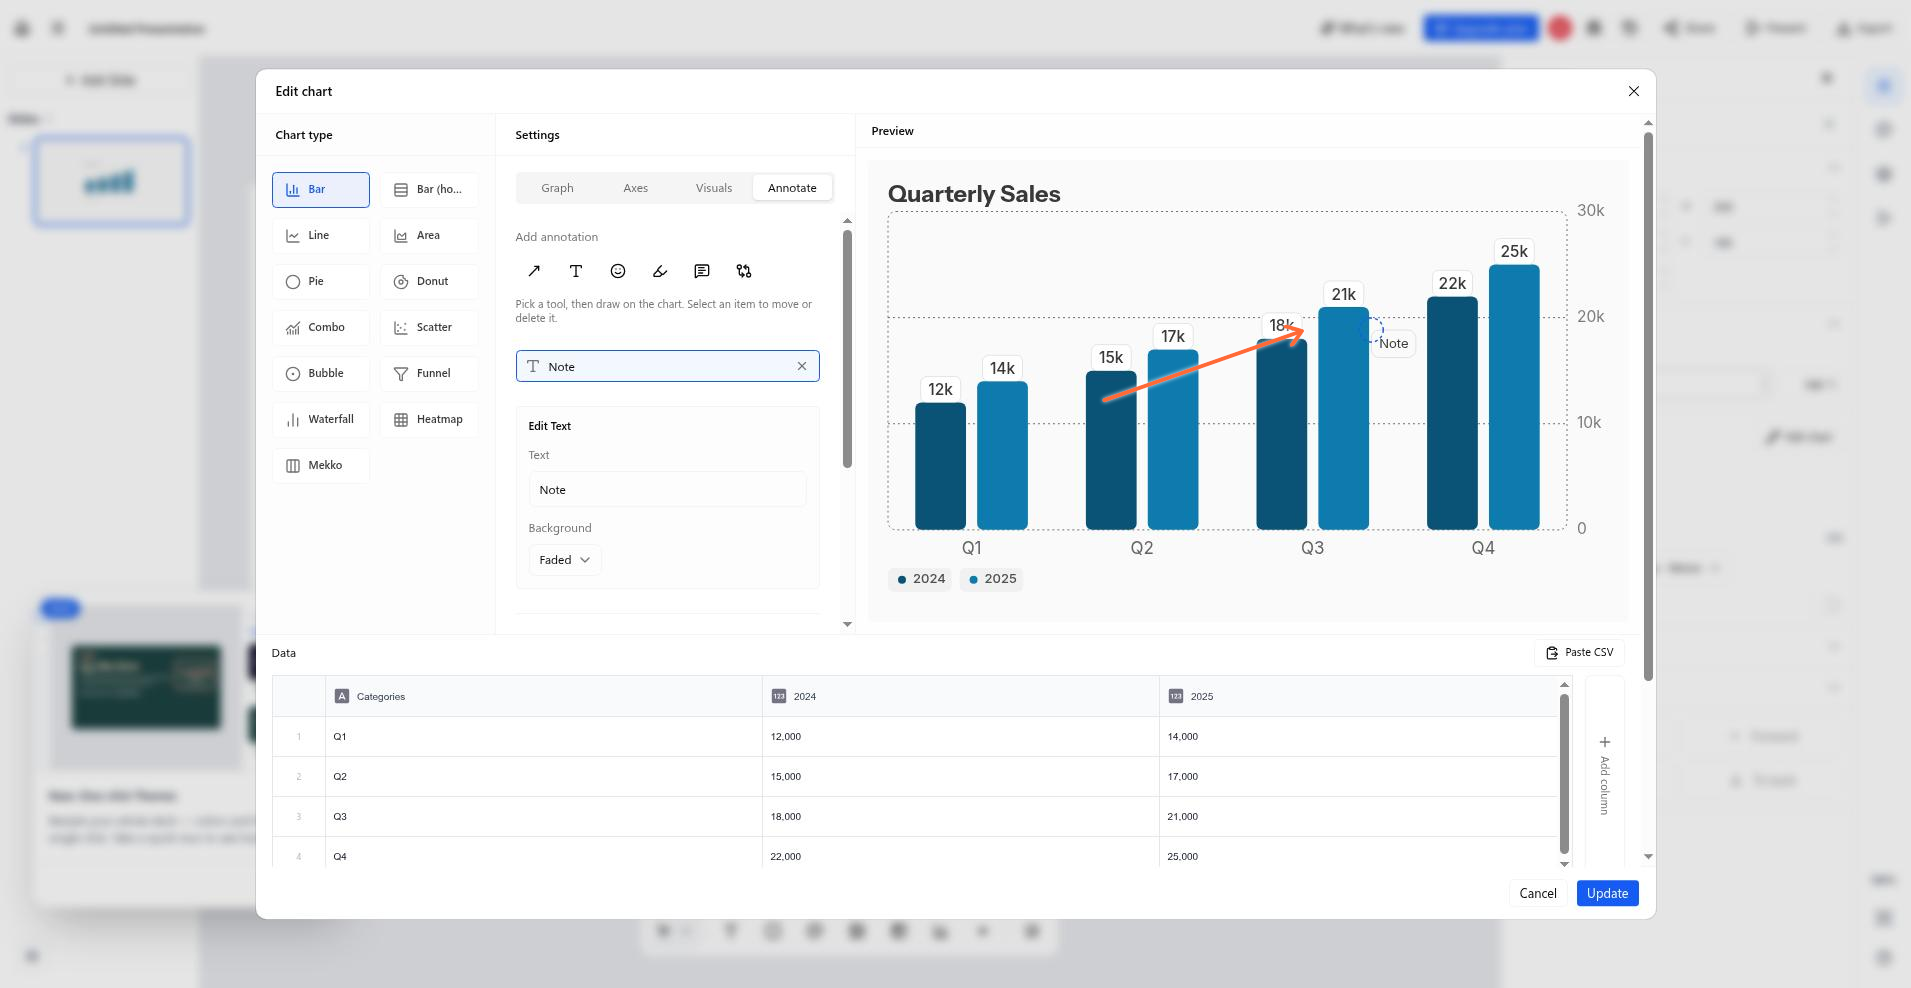
The Text tool places a note you can restyle.
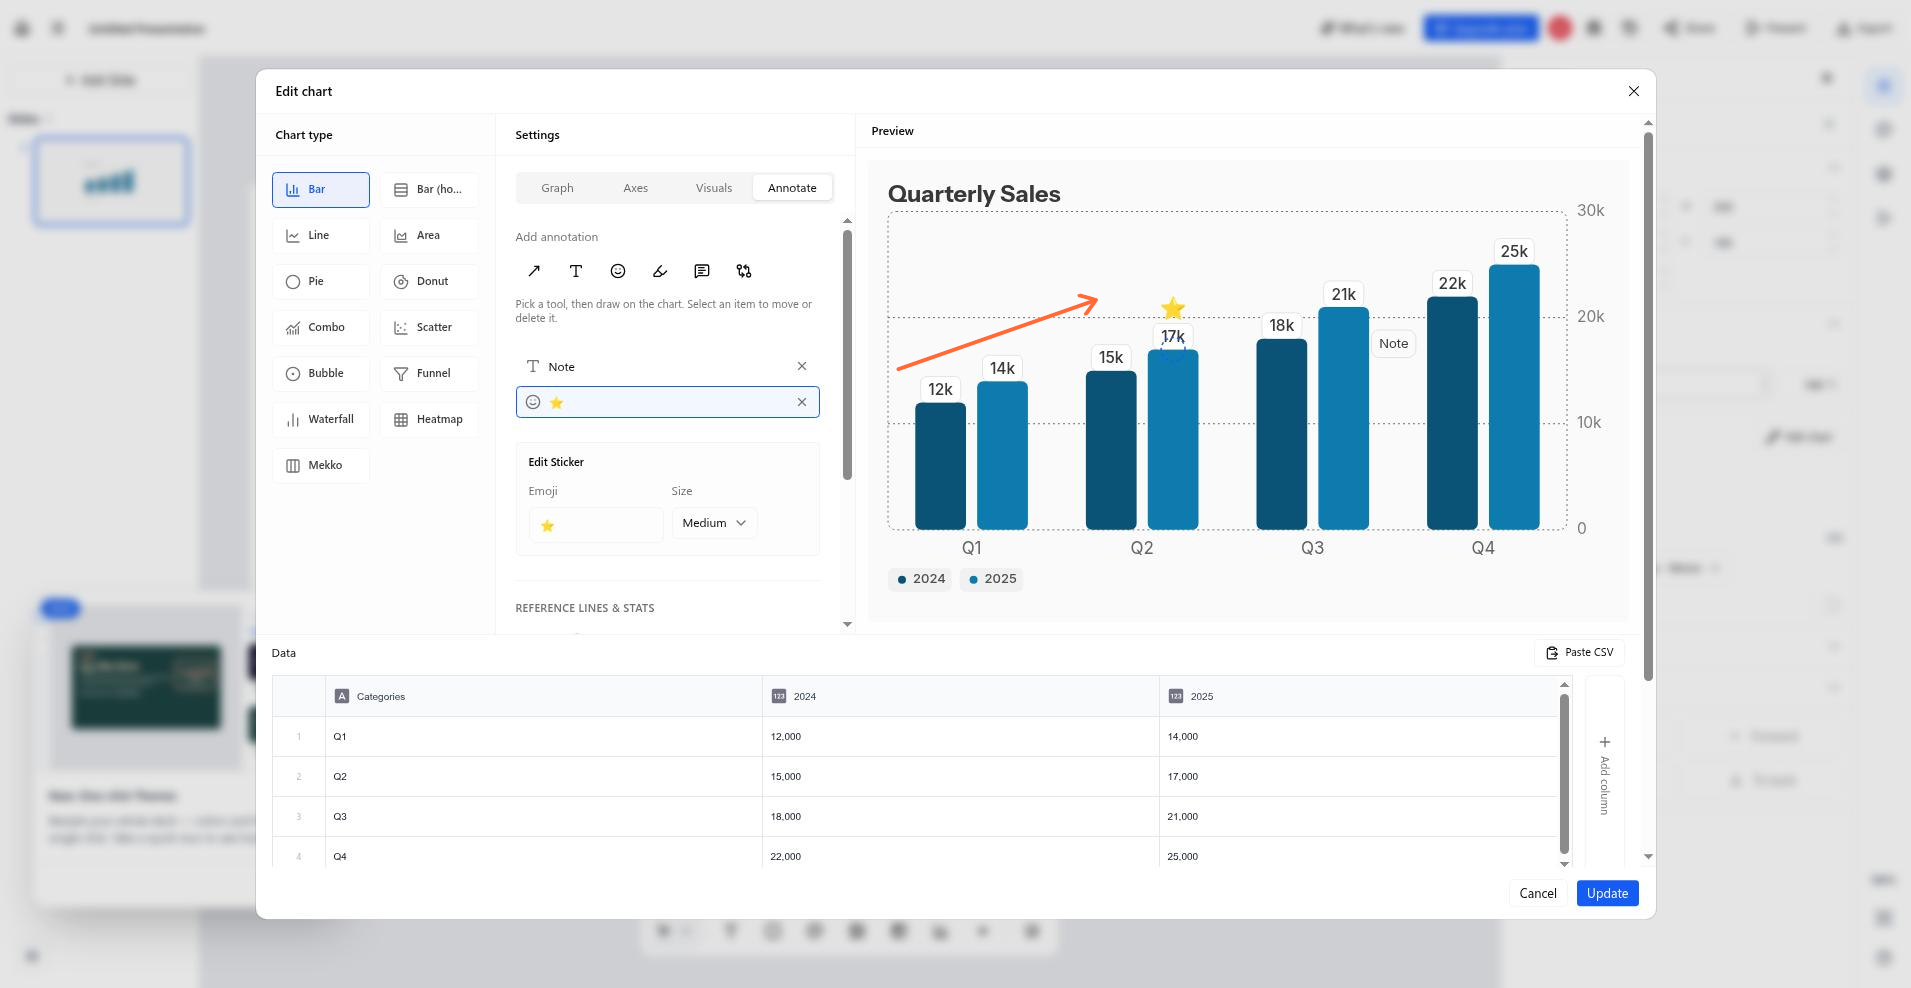
The Sticker tool drops an emoji on a data point.
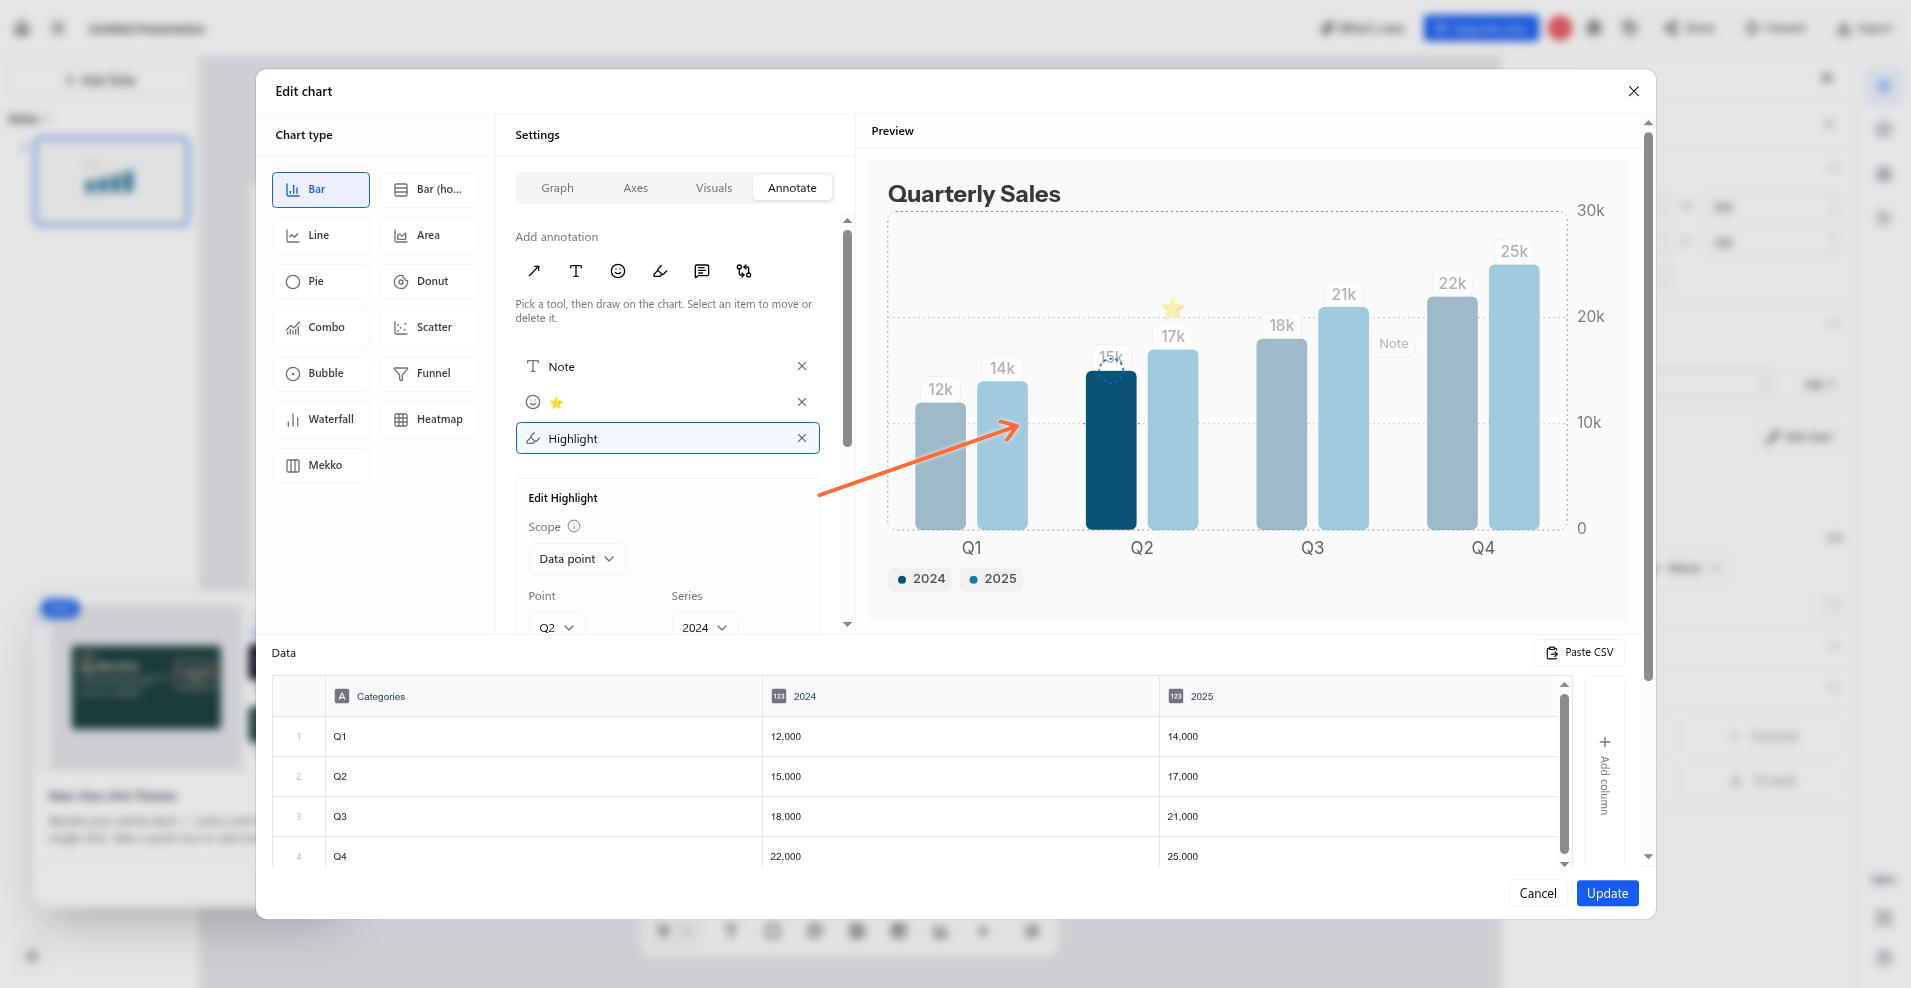
The Highlight tool spotlights a data point, series, or category.
The Tooltip tool pins a text callout to a data point.
The Difference tool bridges two data points with a labelled arrow.
World map charts
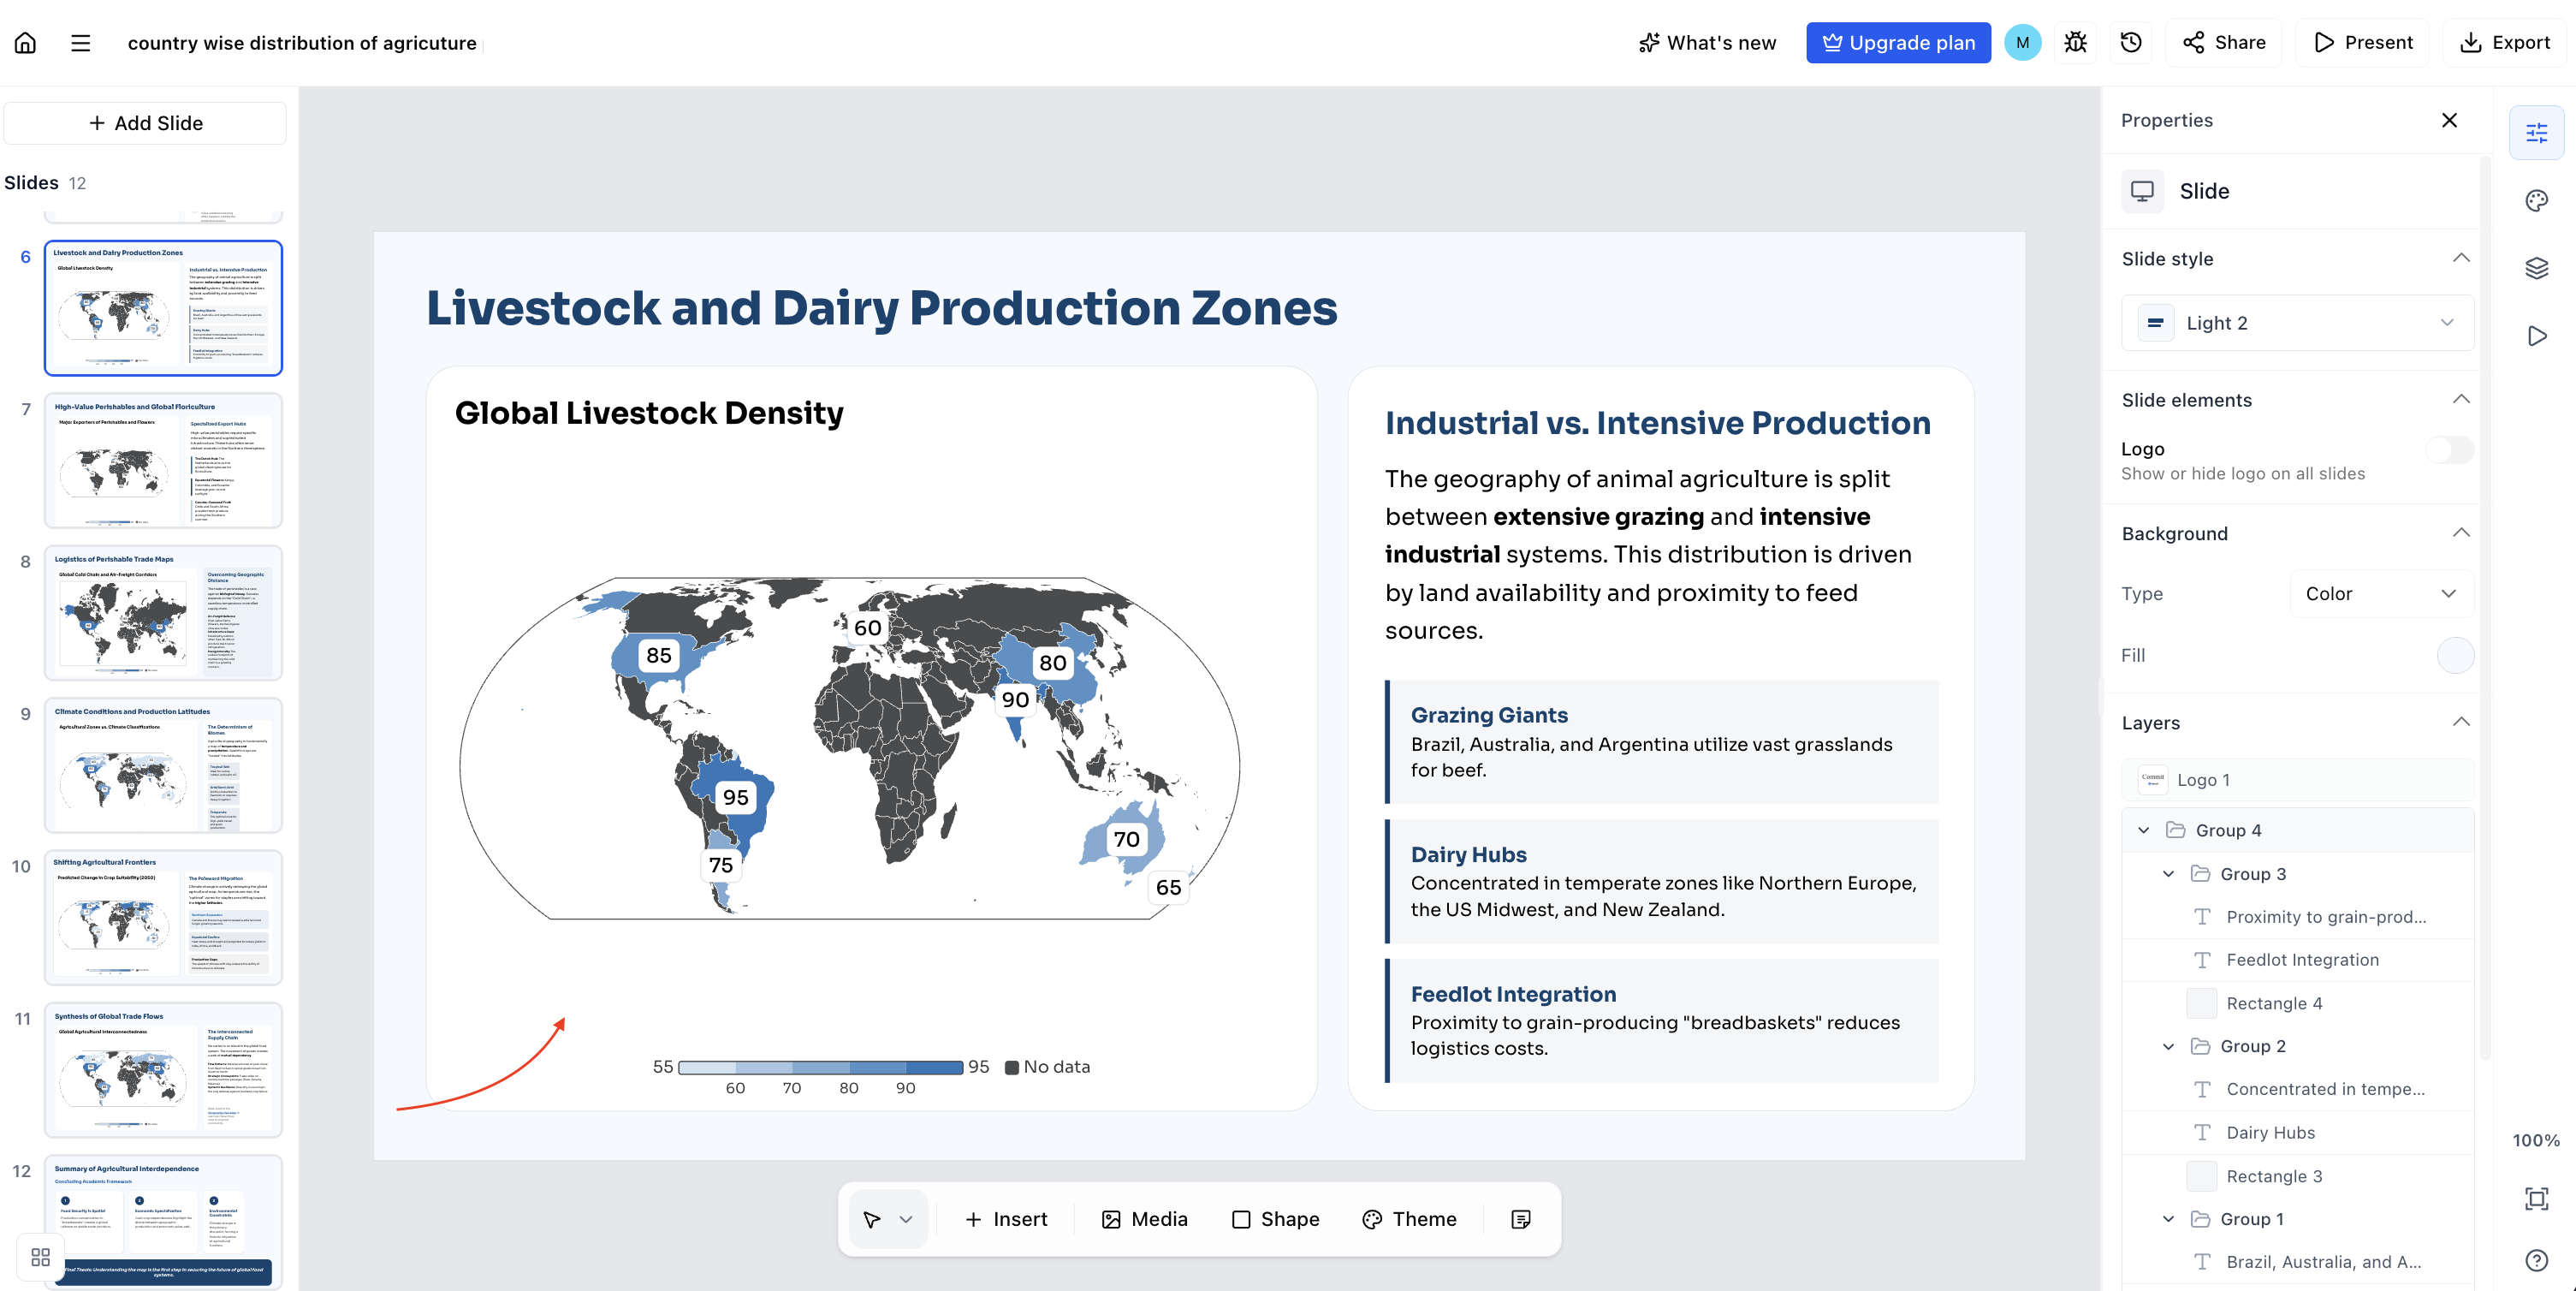
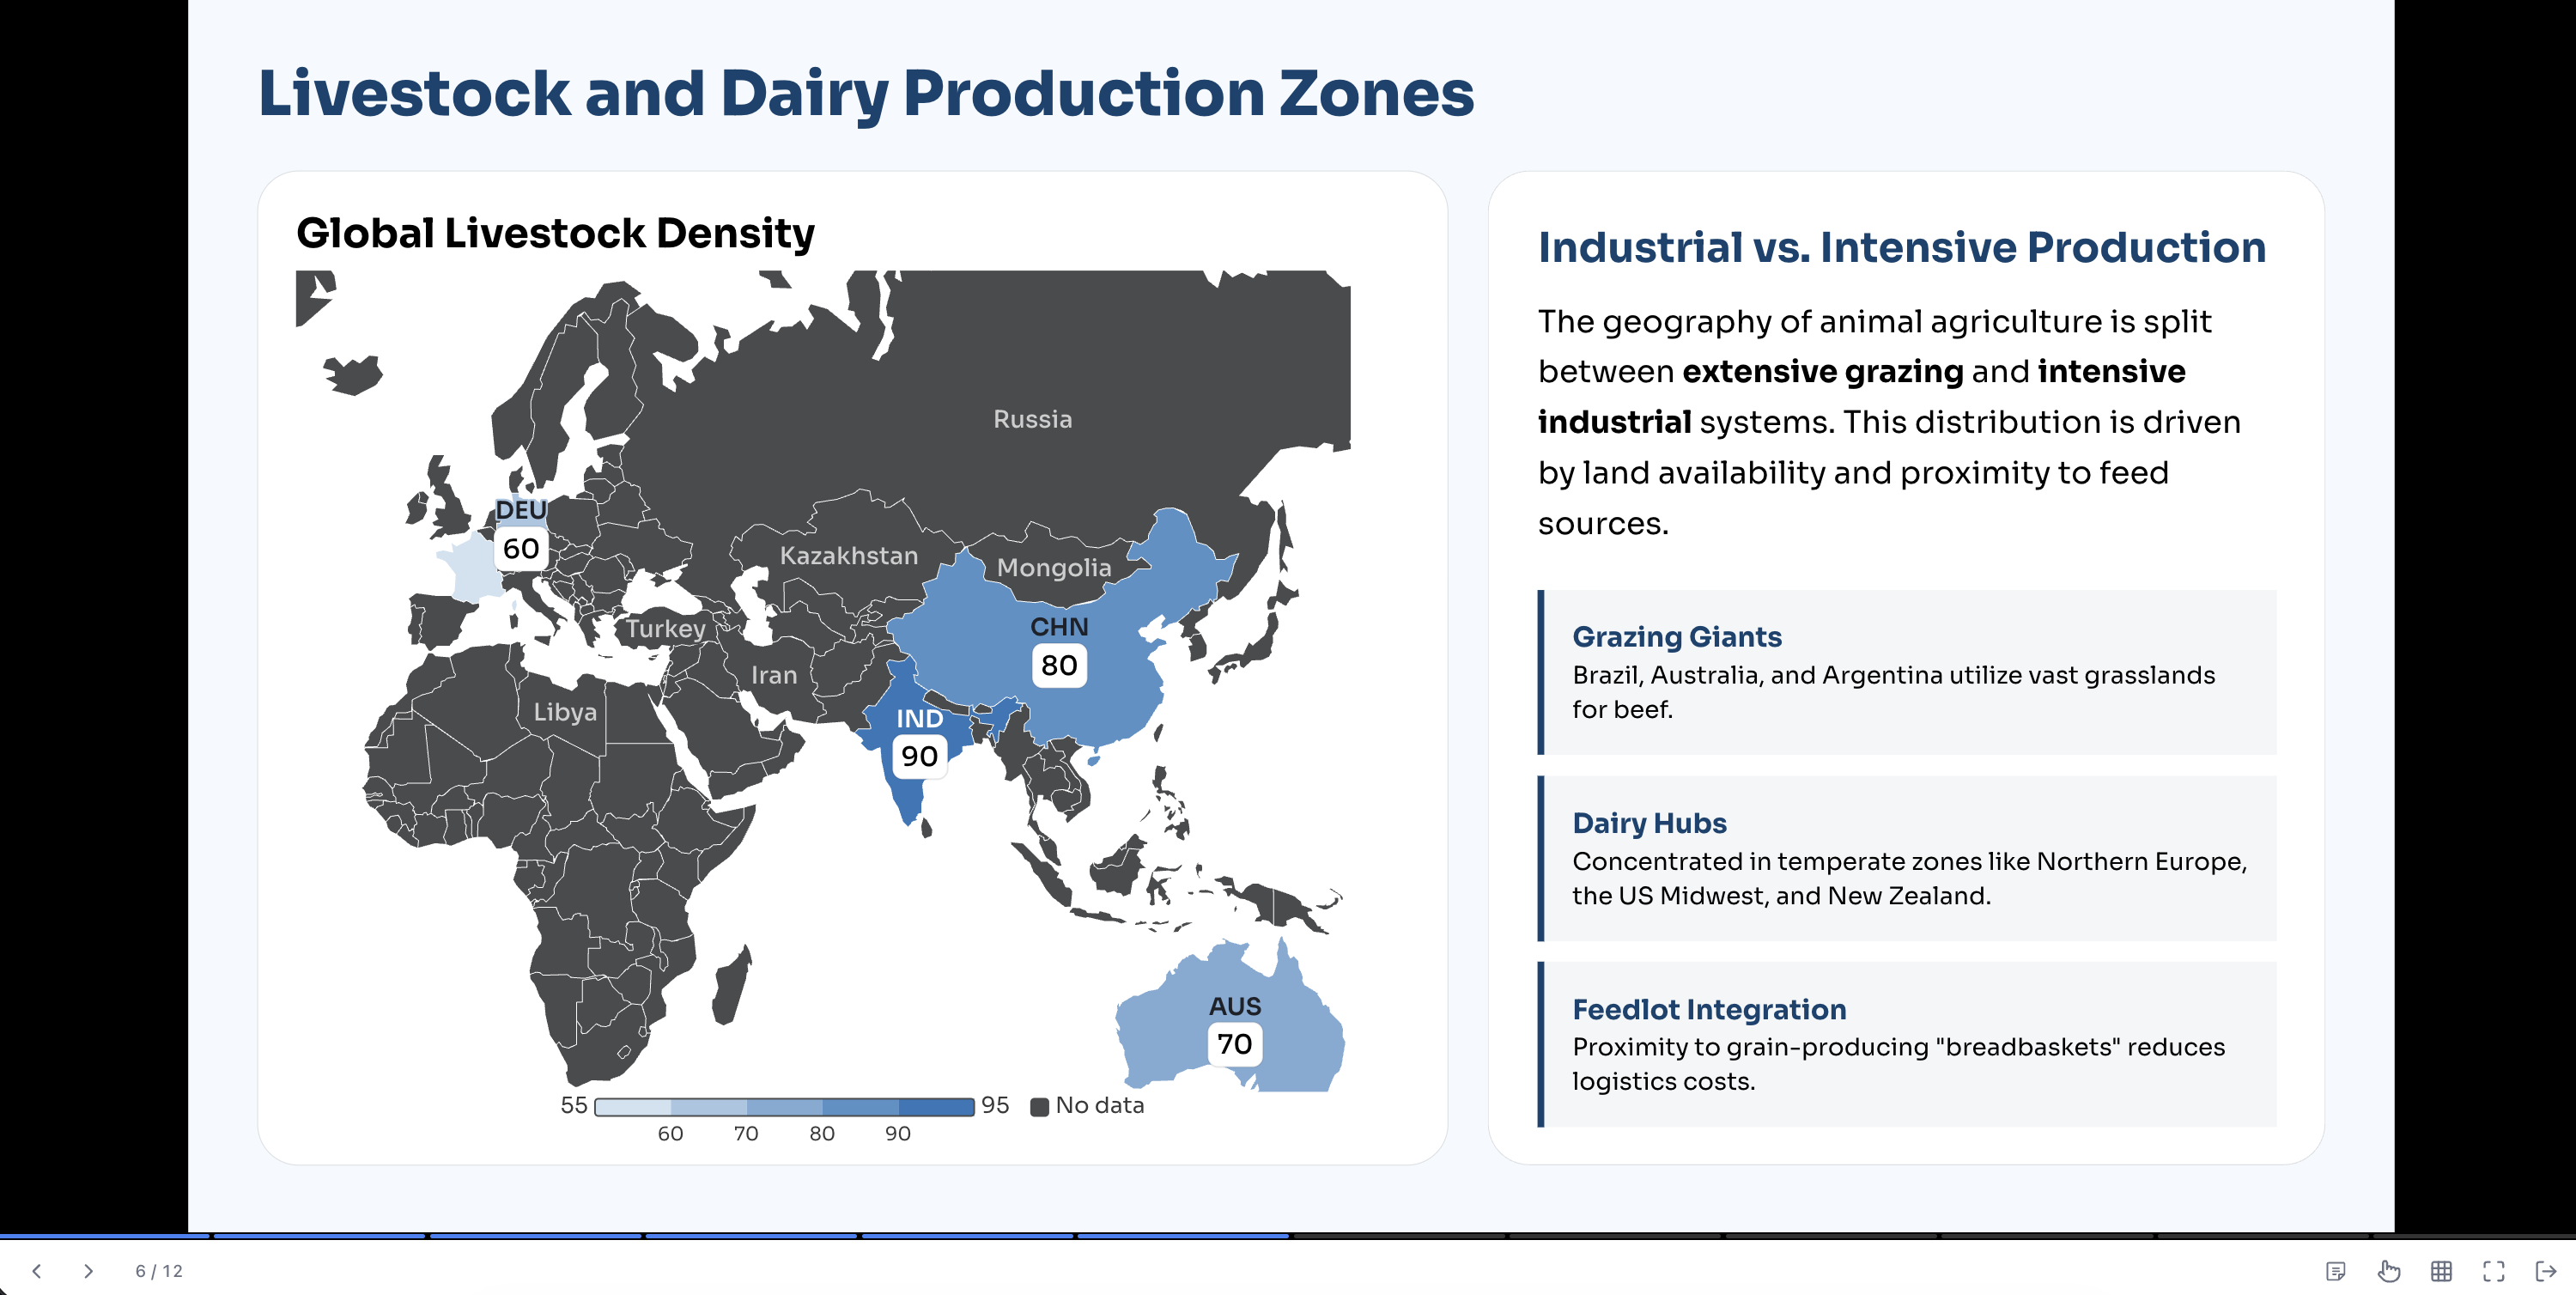
Create world map charts from country names or country codes and values. Choose a shaded-country or bubble style, show country names, values, legends, and annotations, and use zoom, pan, fit-to-data, and reset controls — including in full-screen Present mode, where map navigation is temporary and does not change the saved slide.
Funnel charts with conversion details
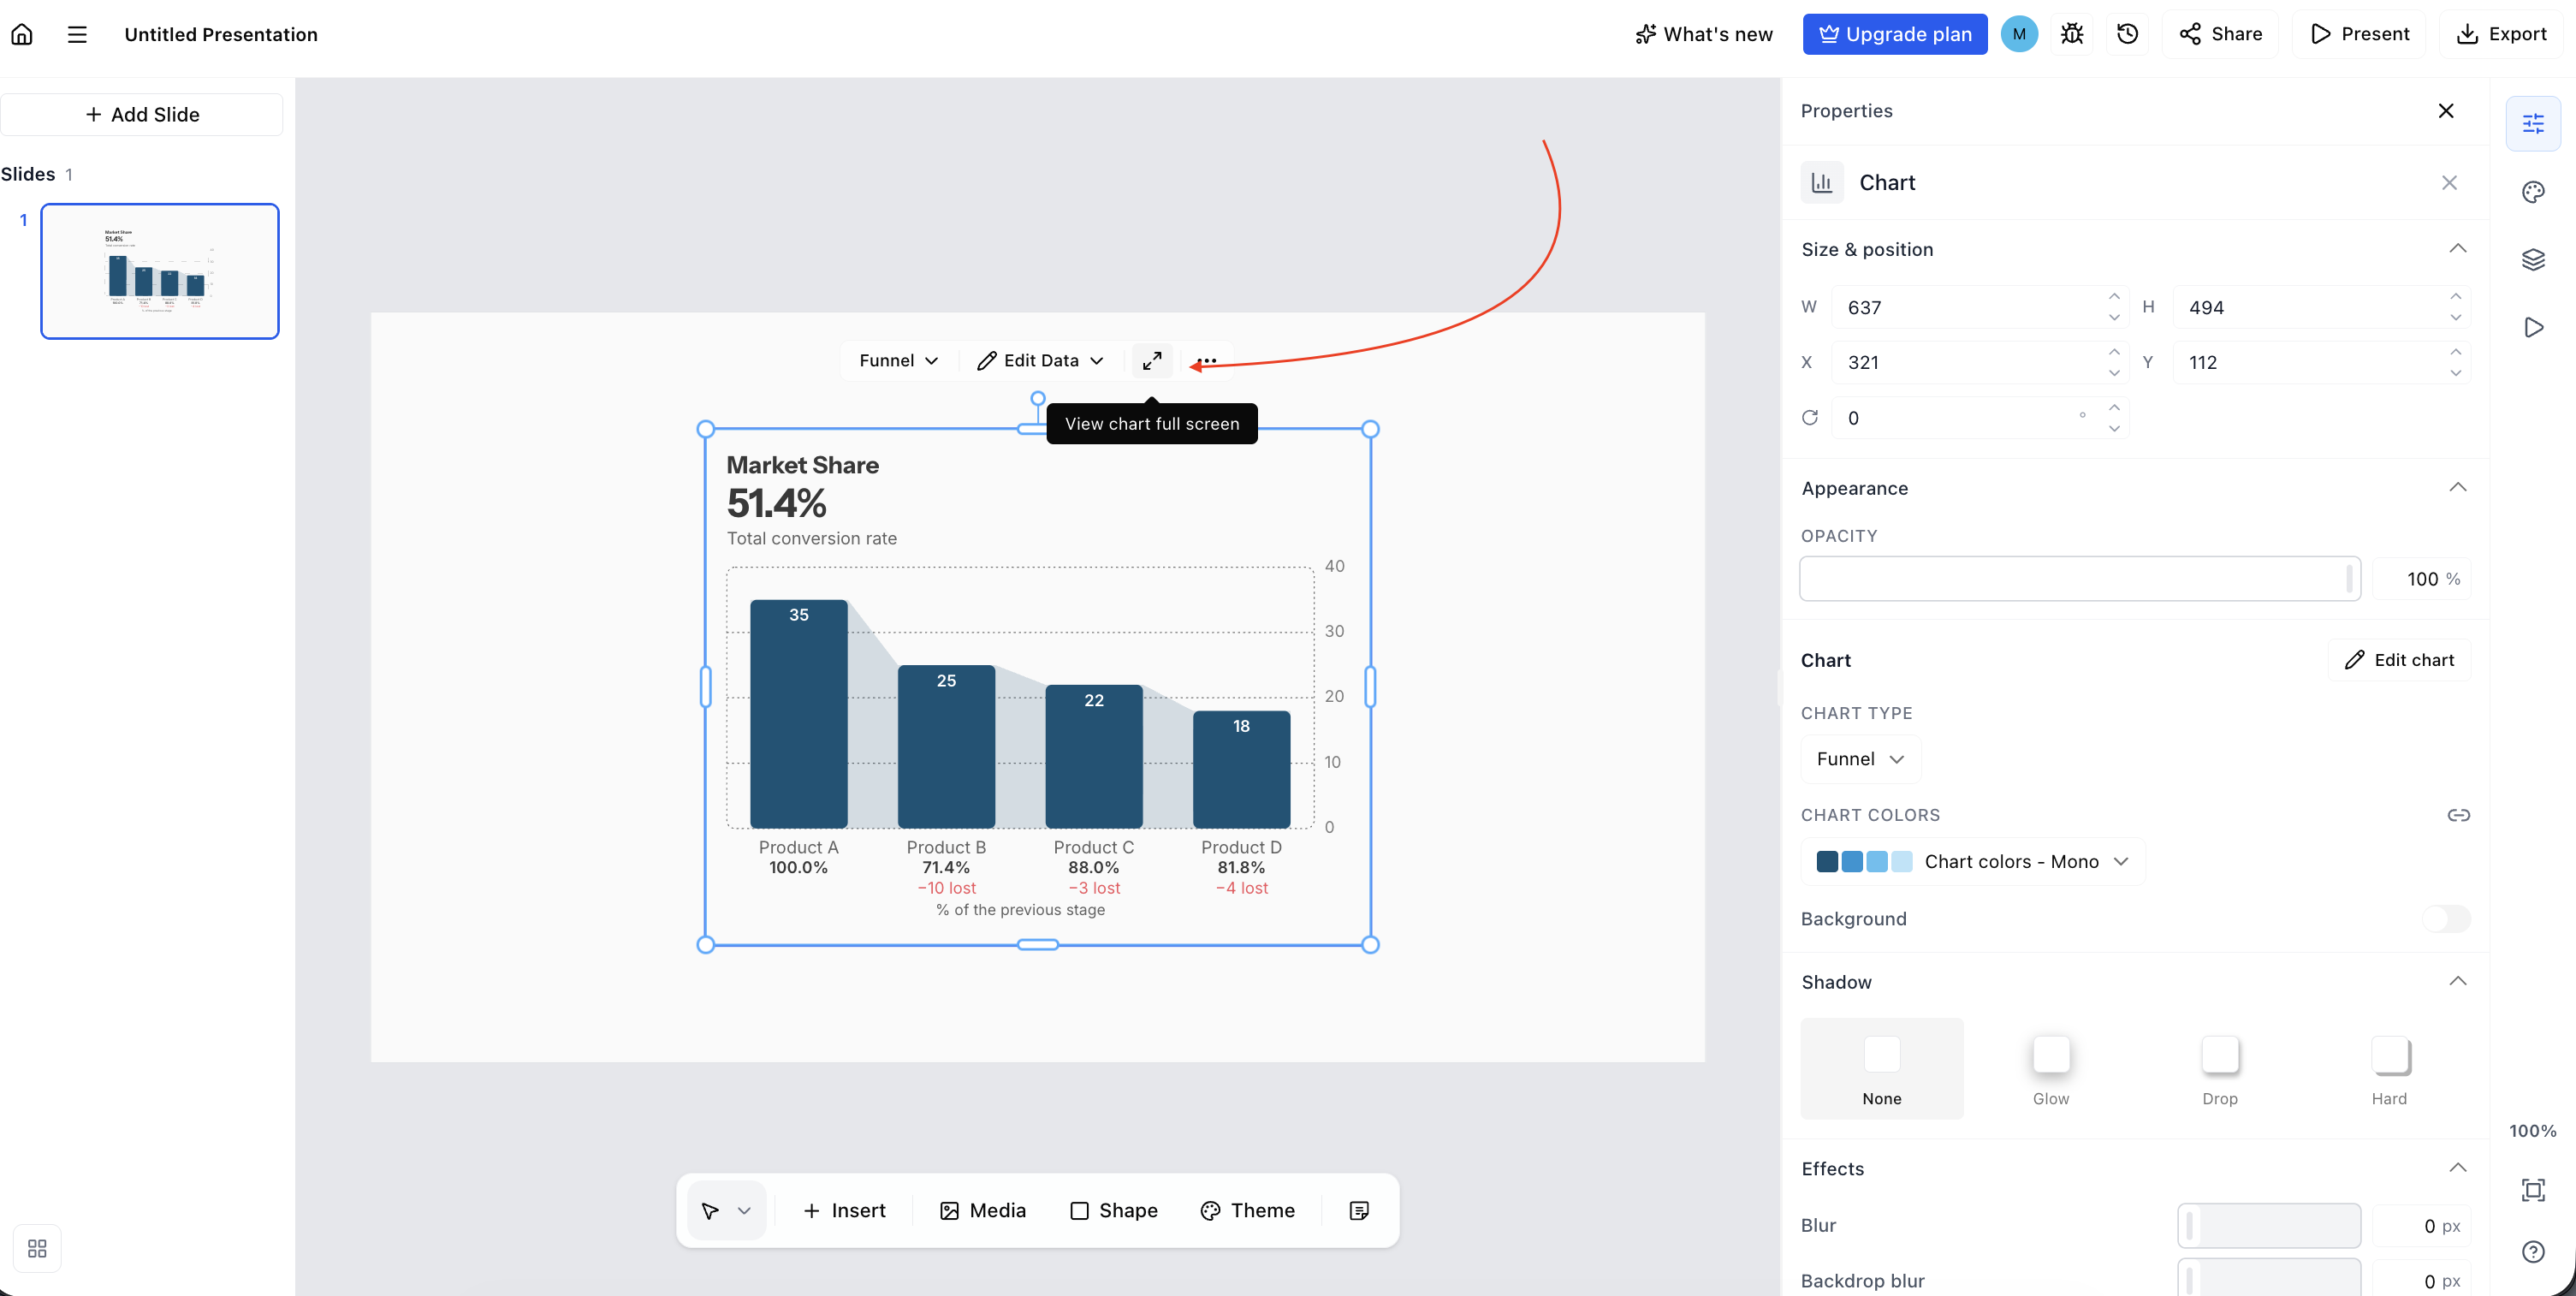
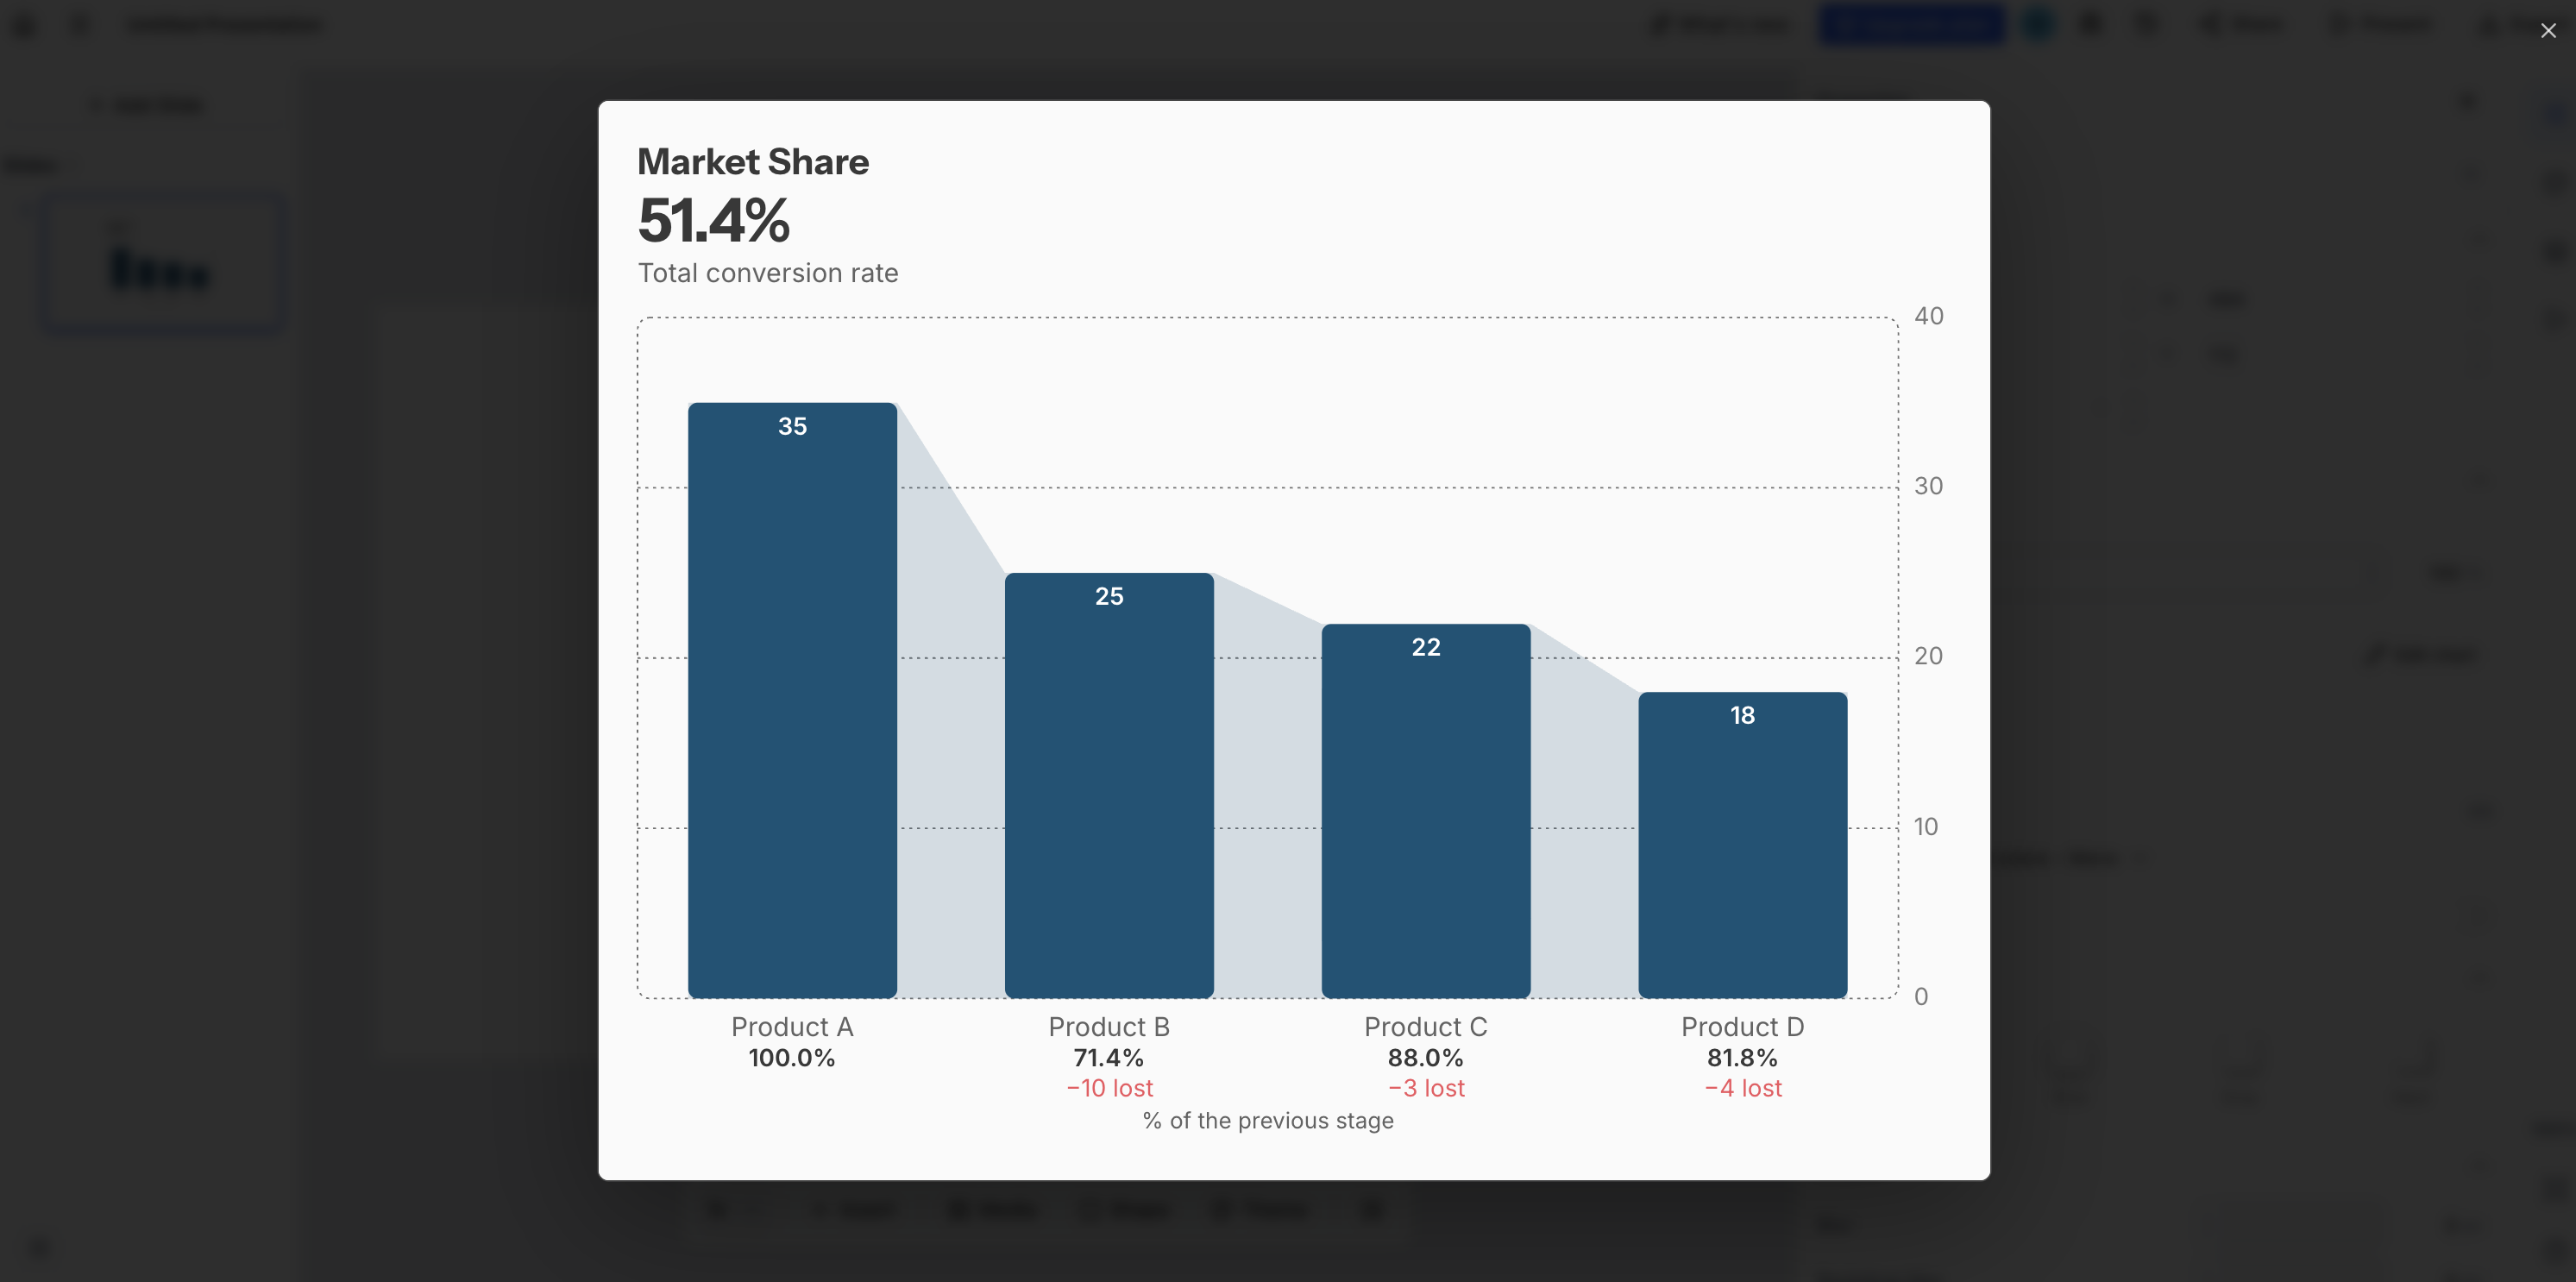
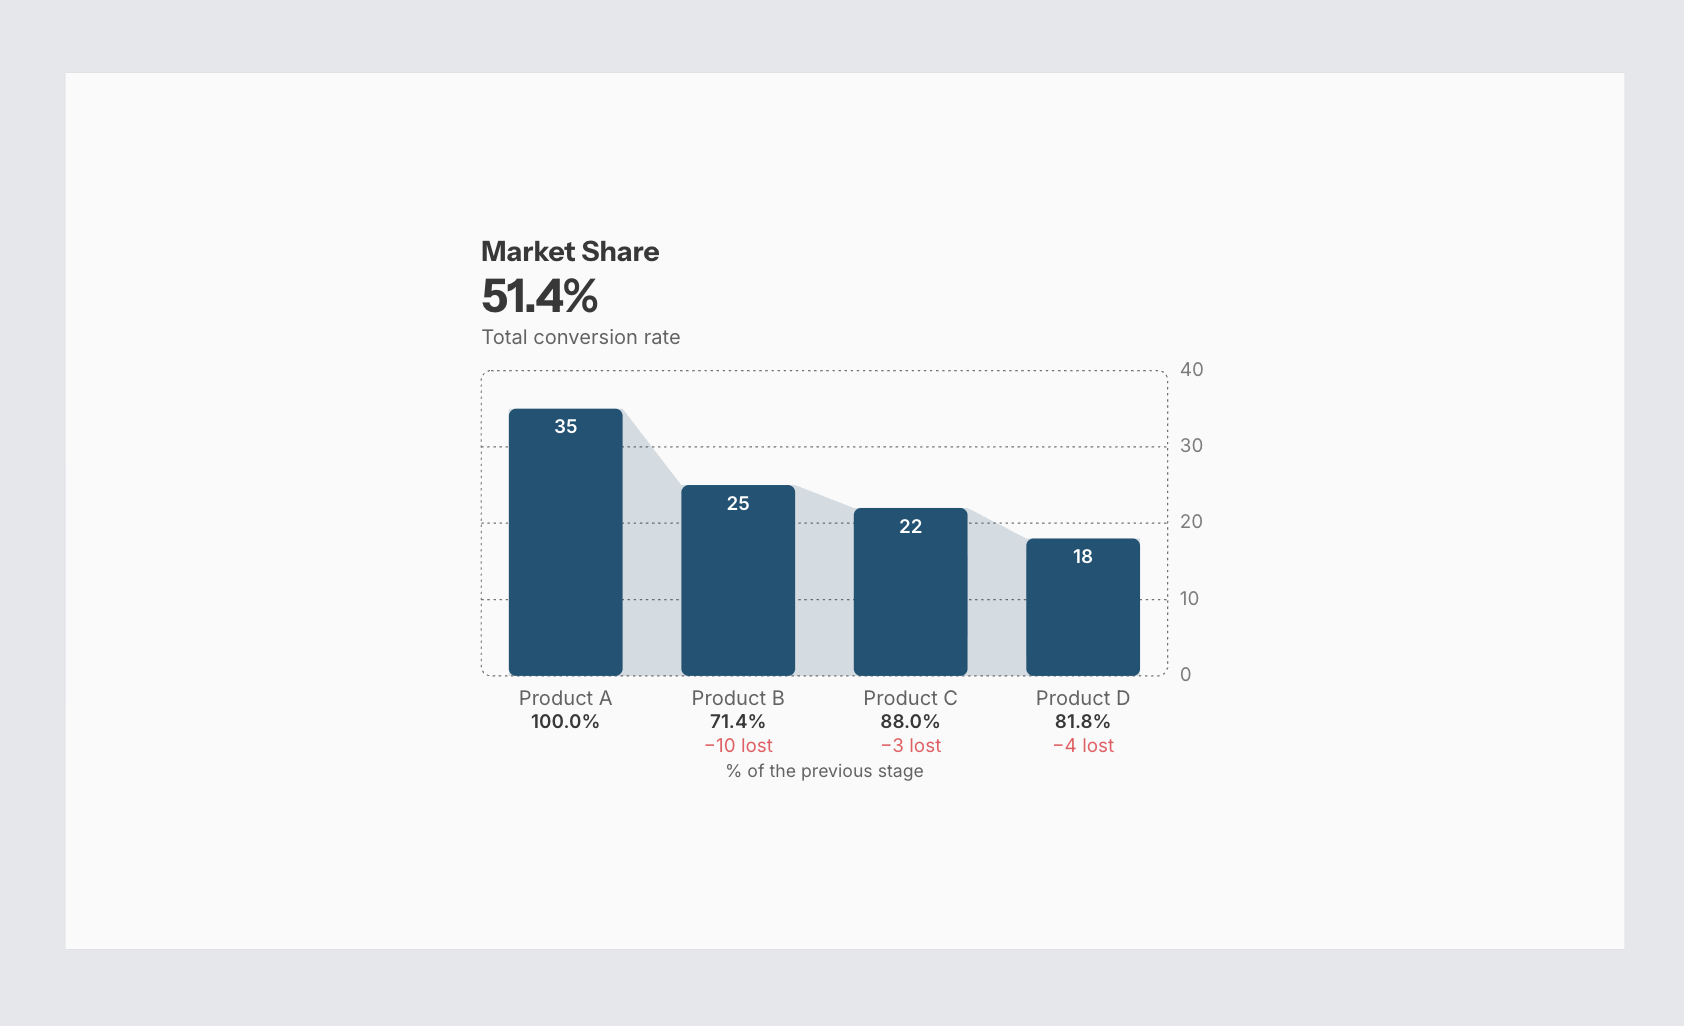
Funnel charts can now show conversion rates and drop-off counts for each stage, comparing against the previous stage or the first stage, so you can read the health of each step at a glance.
Mermaid diagrams generated and editable
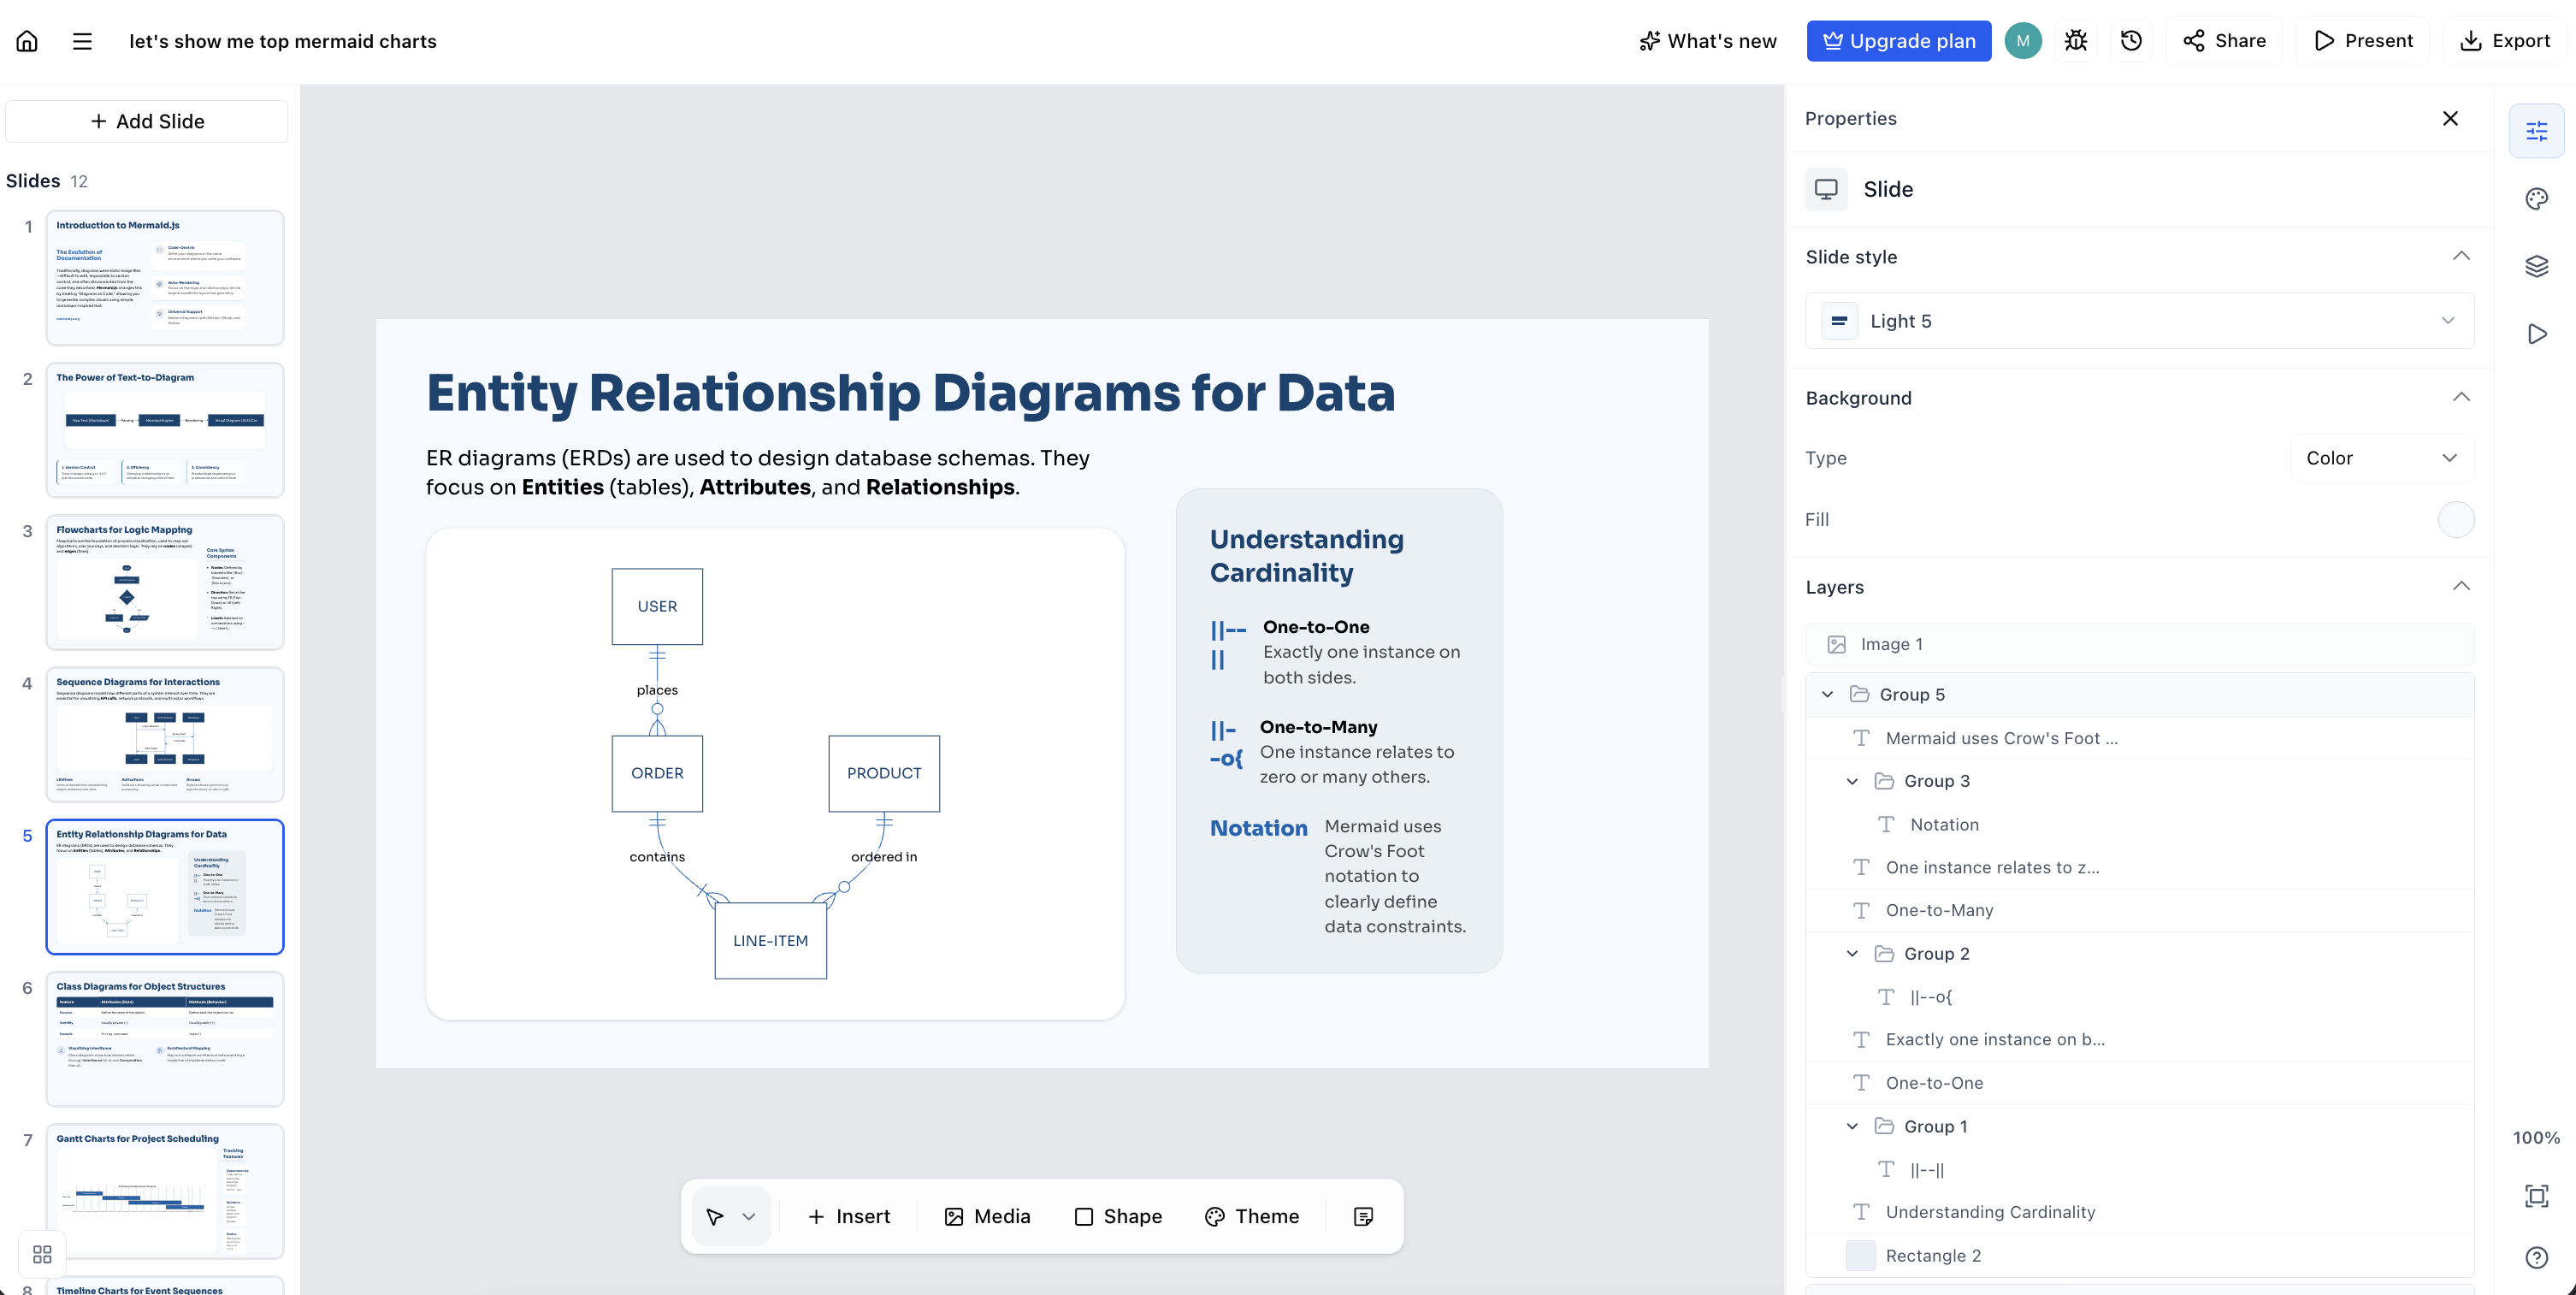
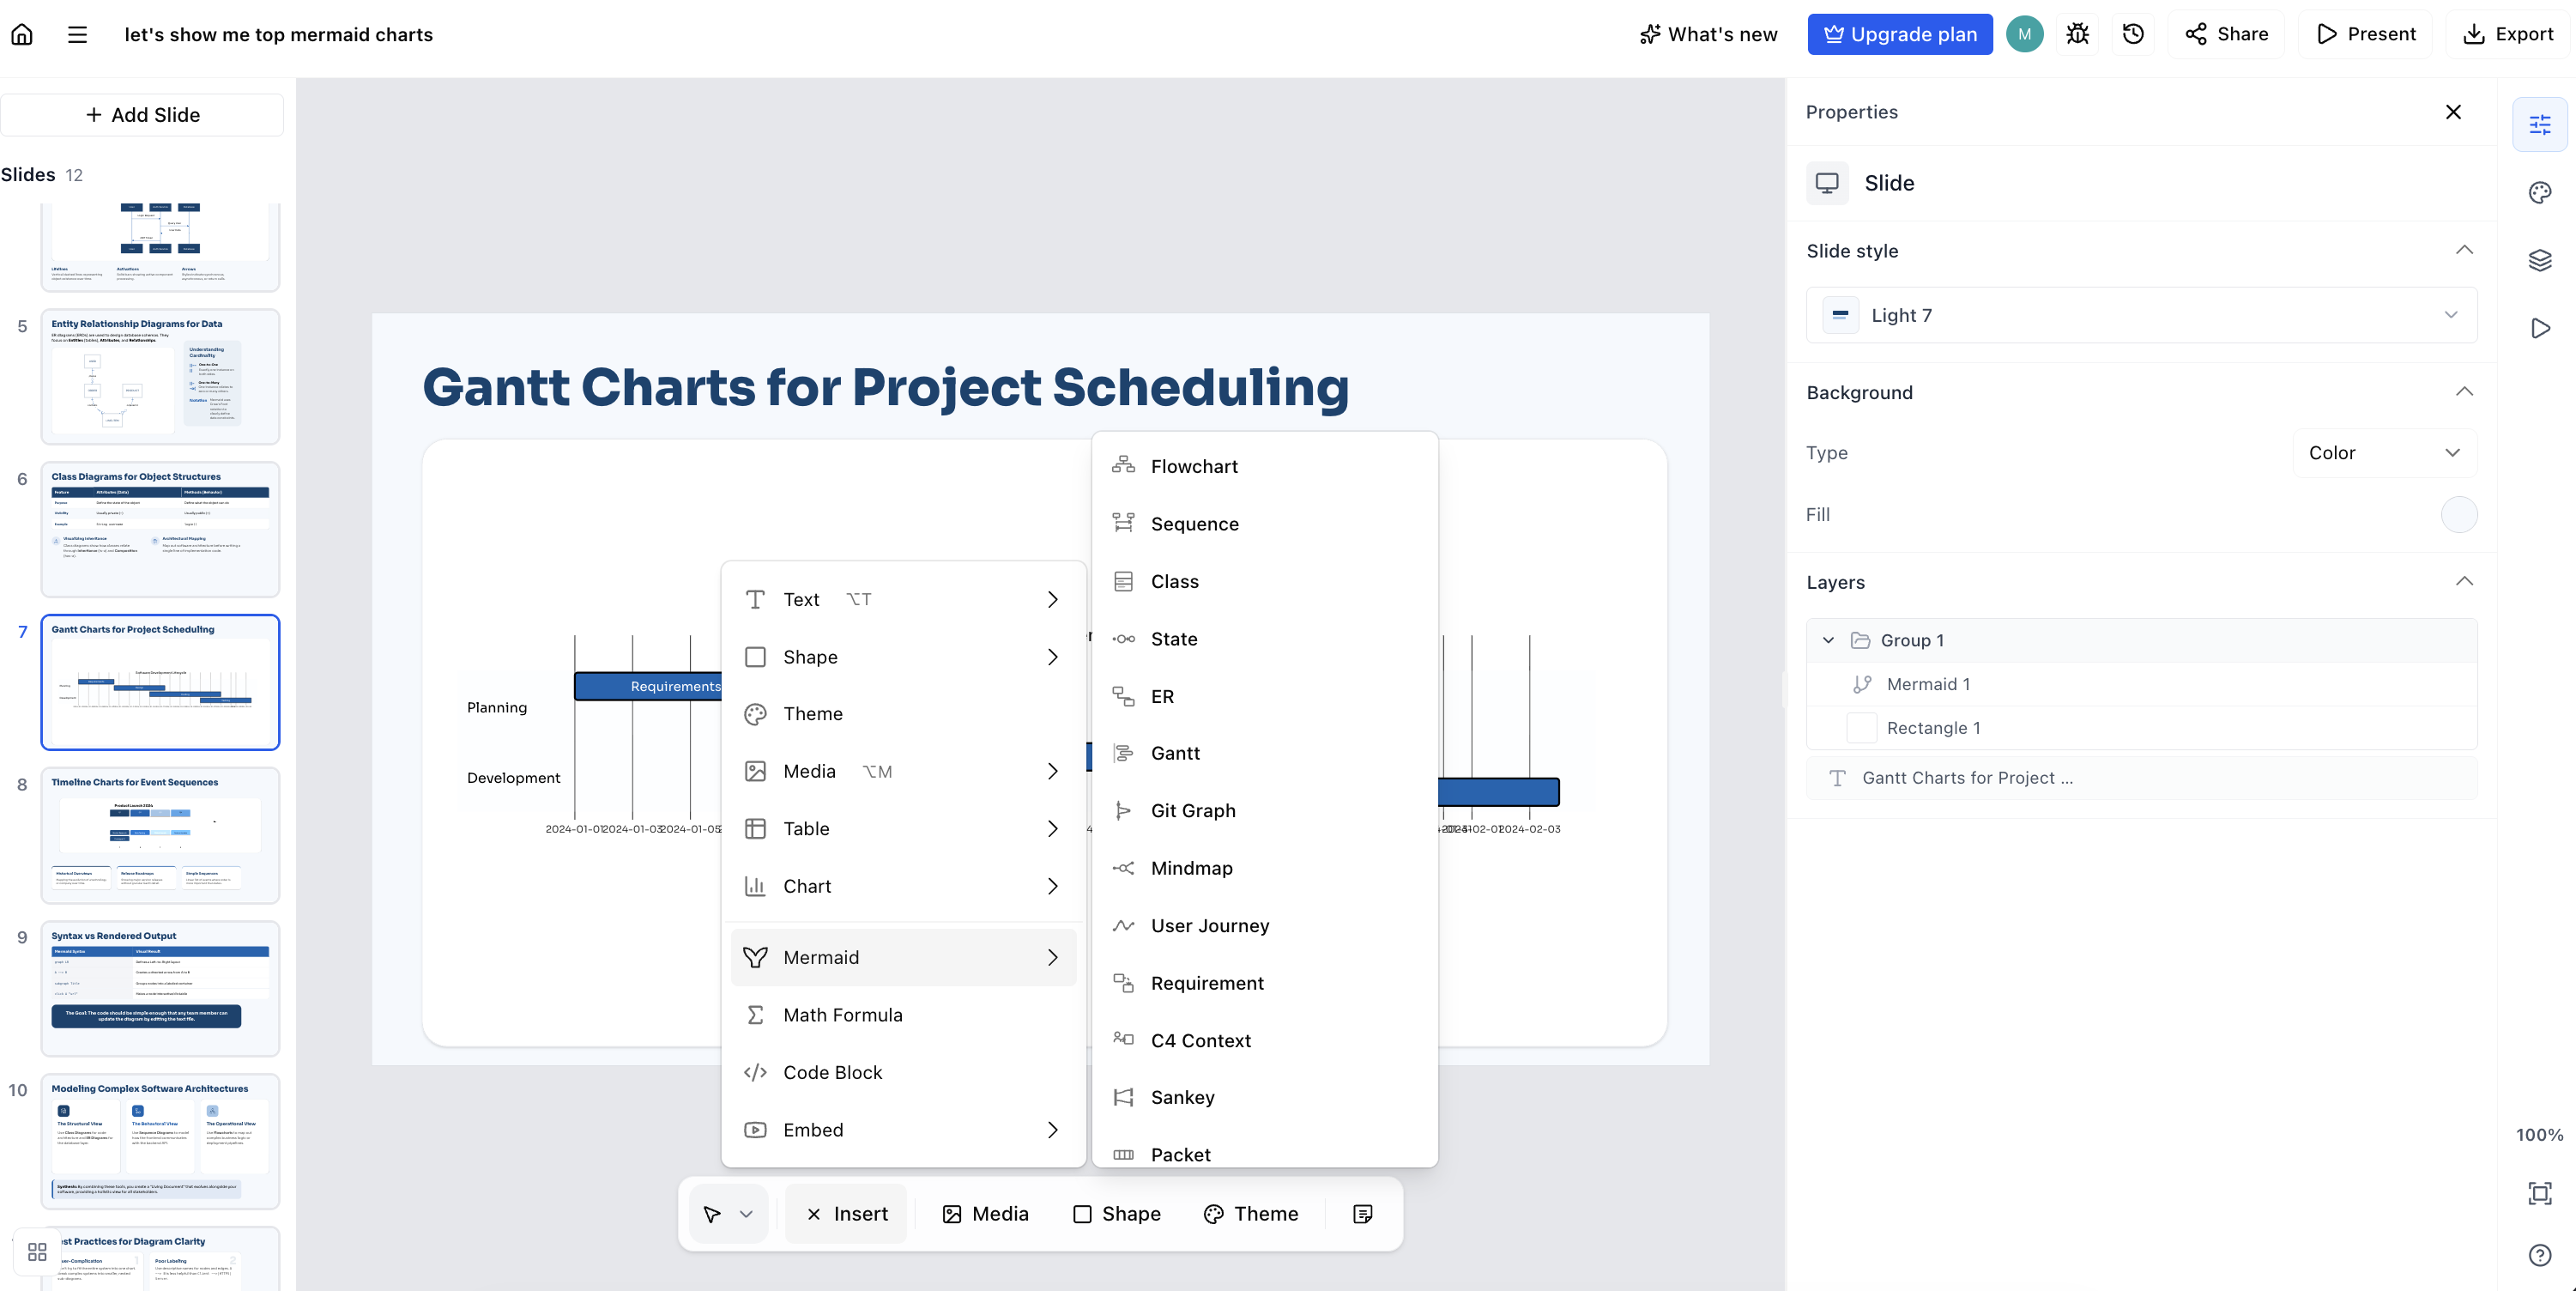
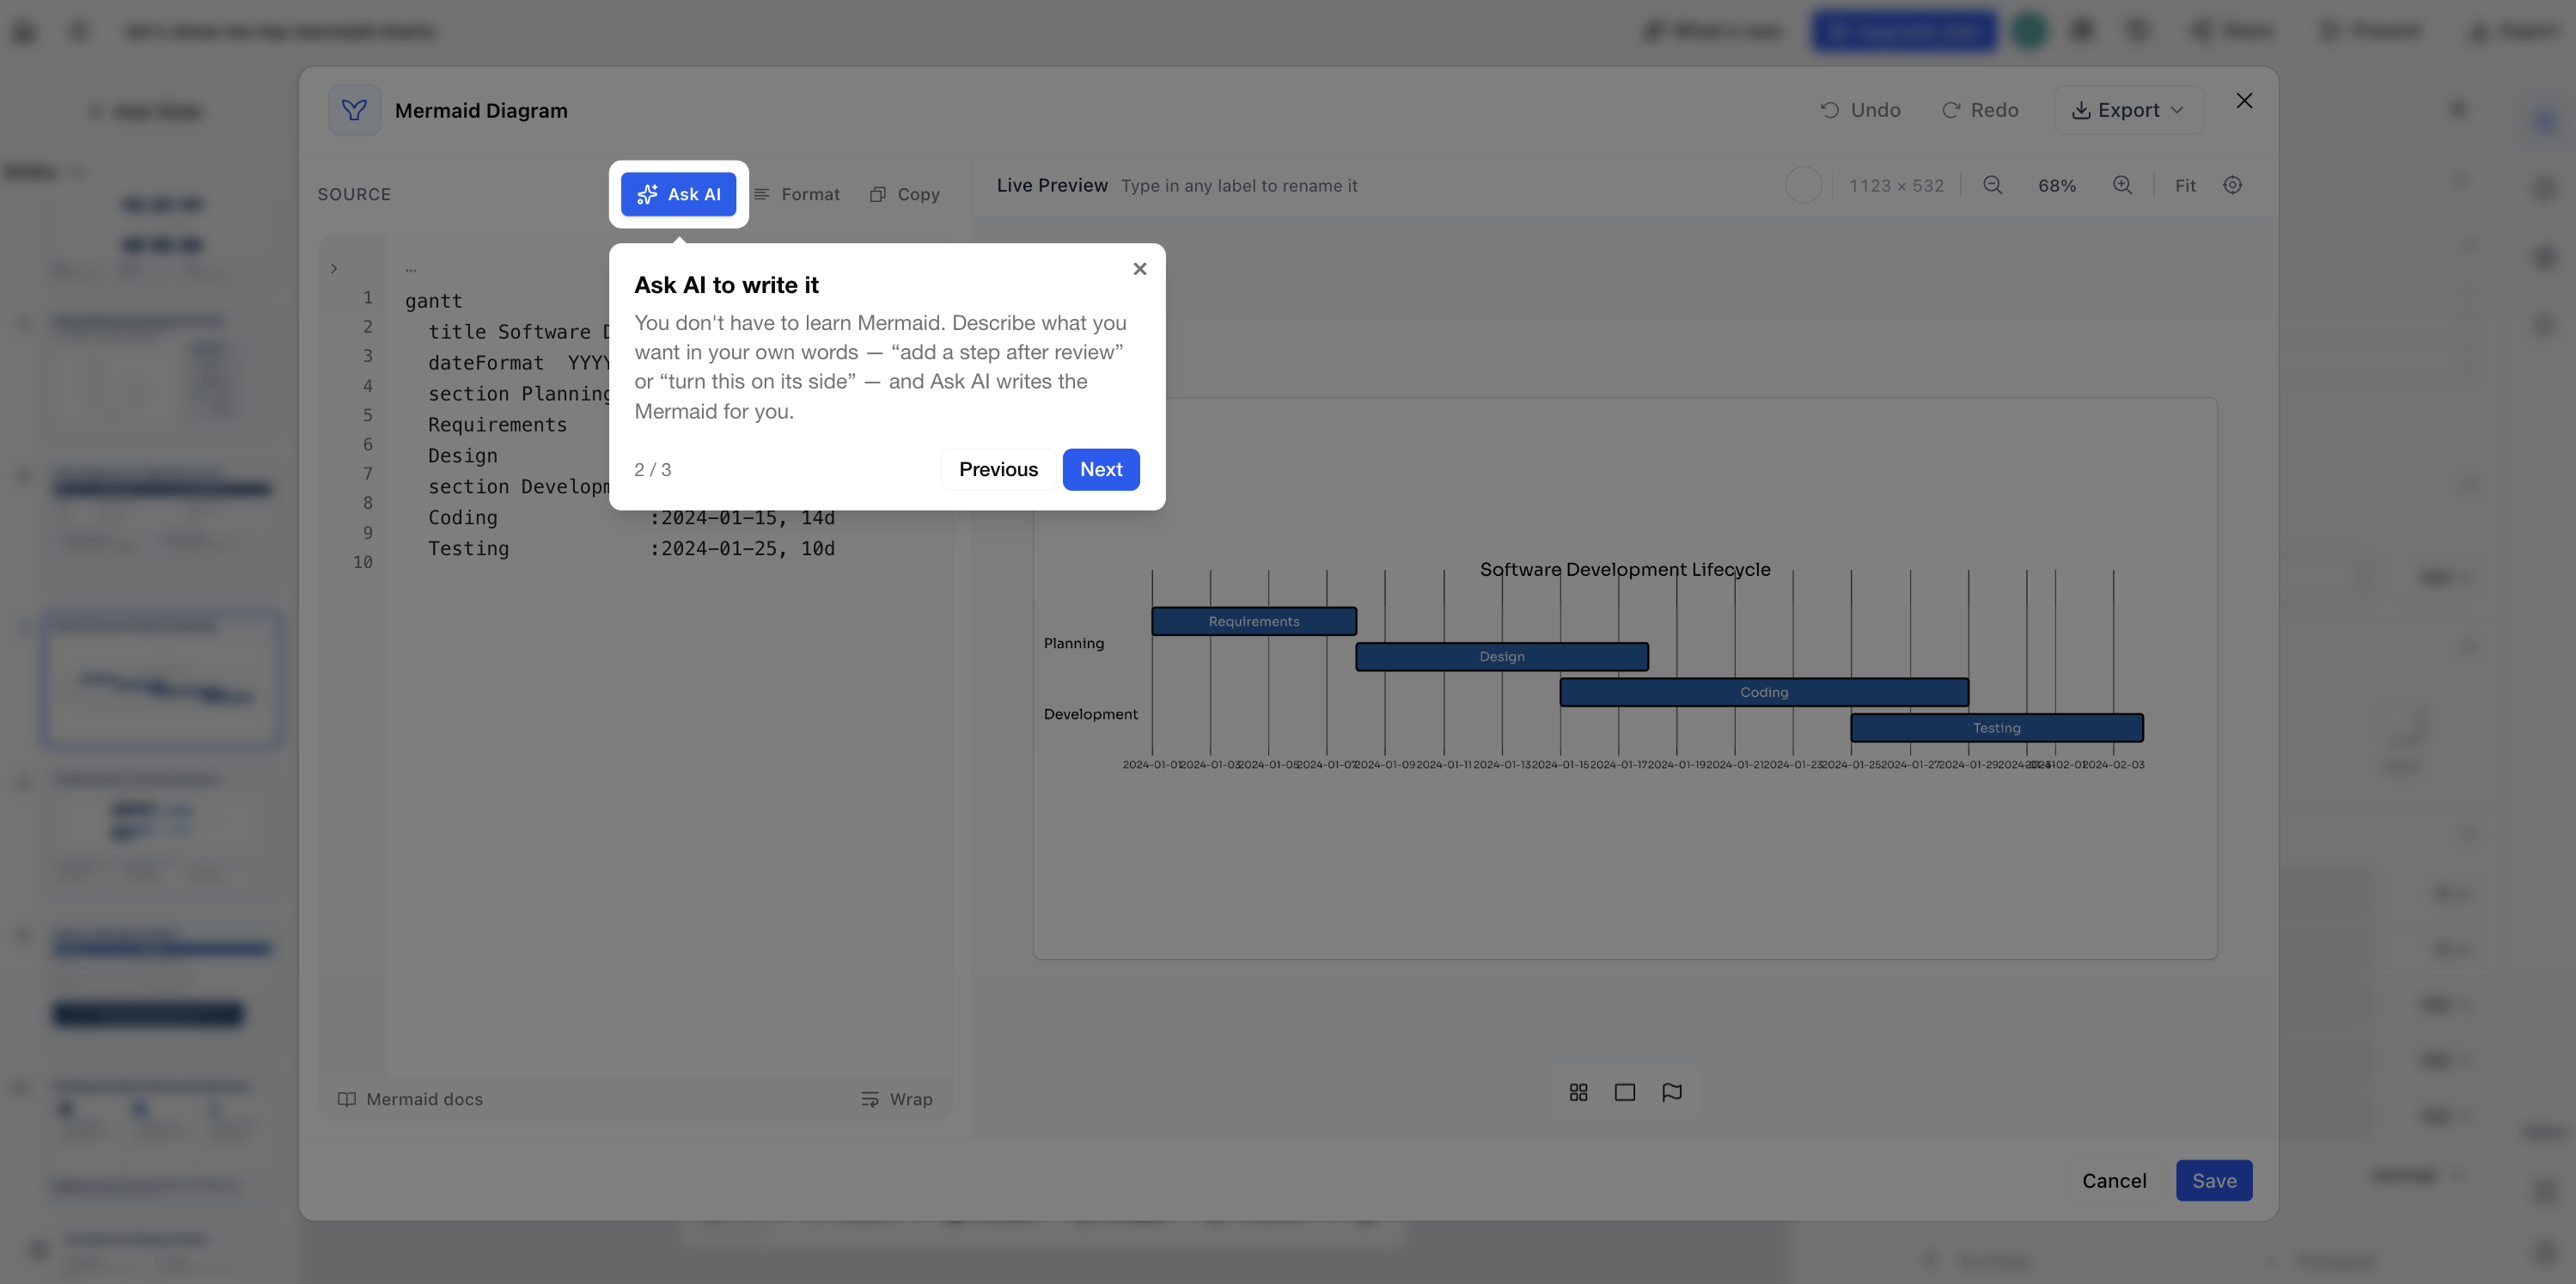
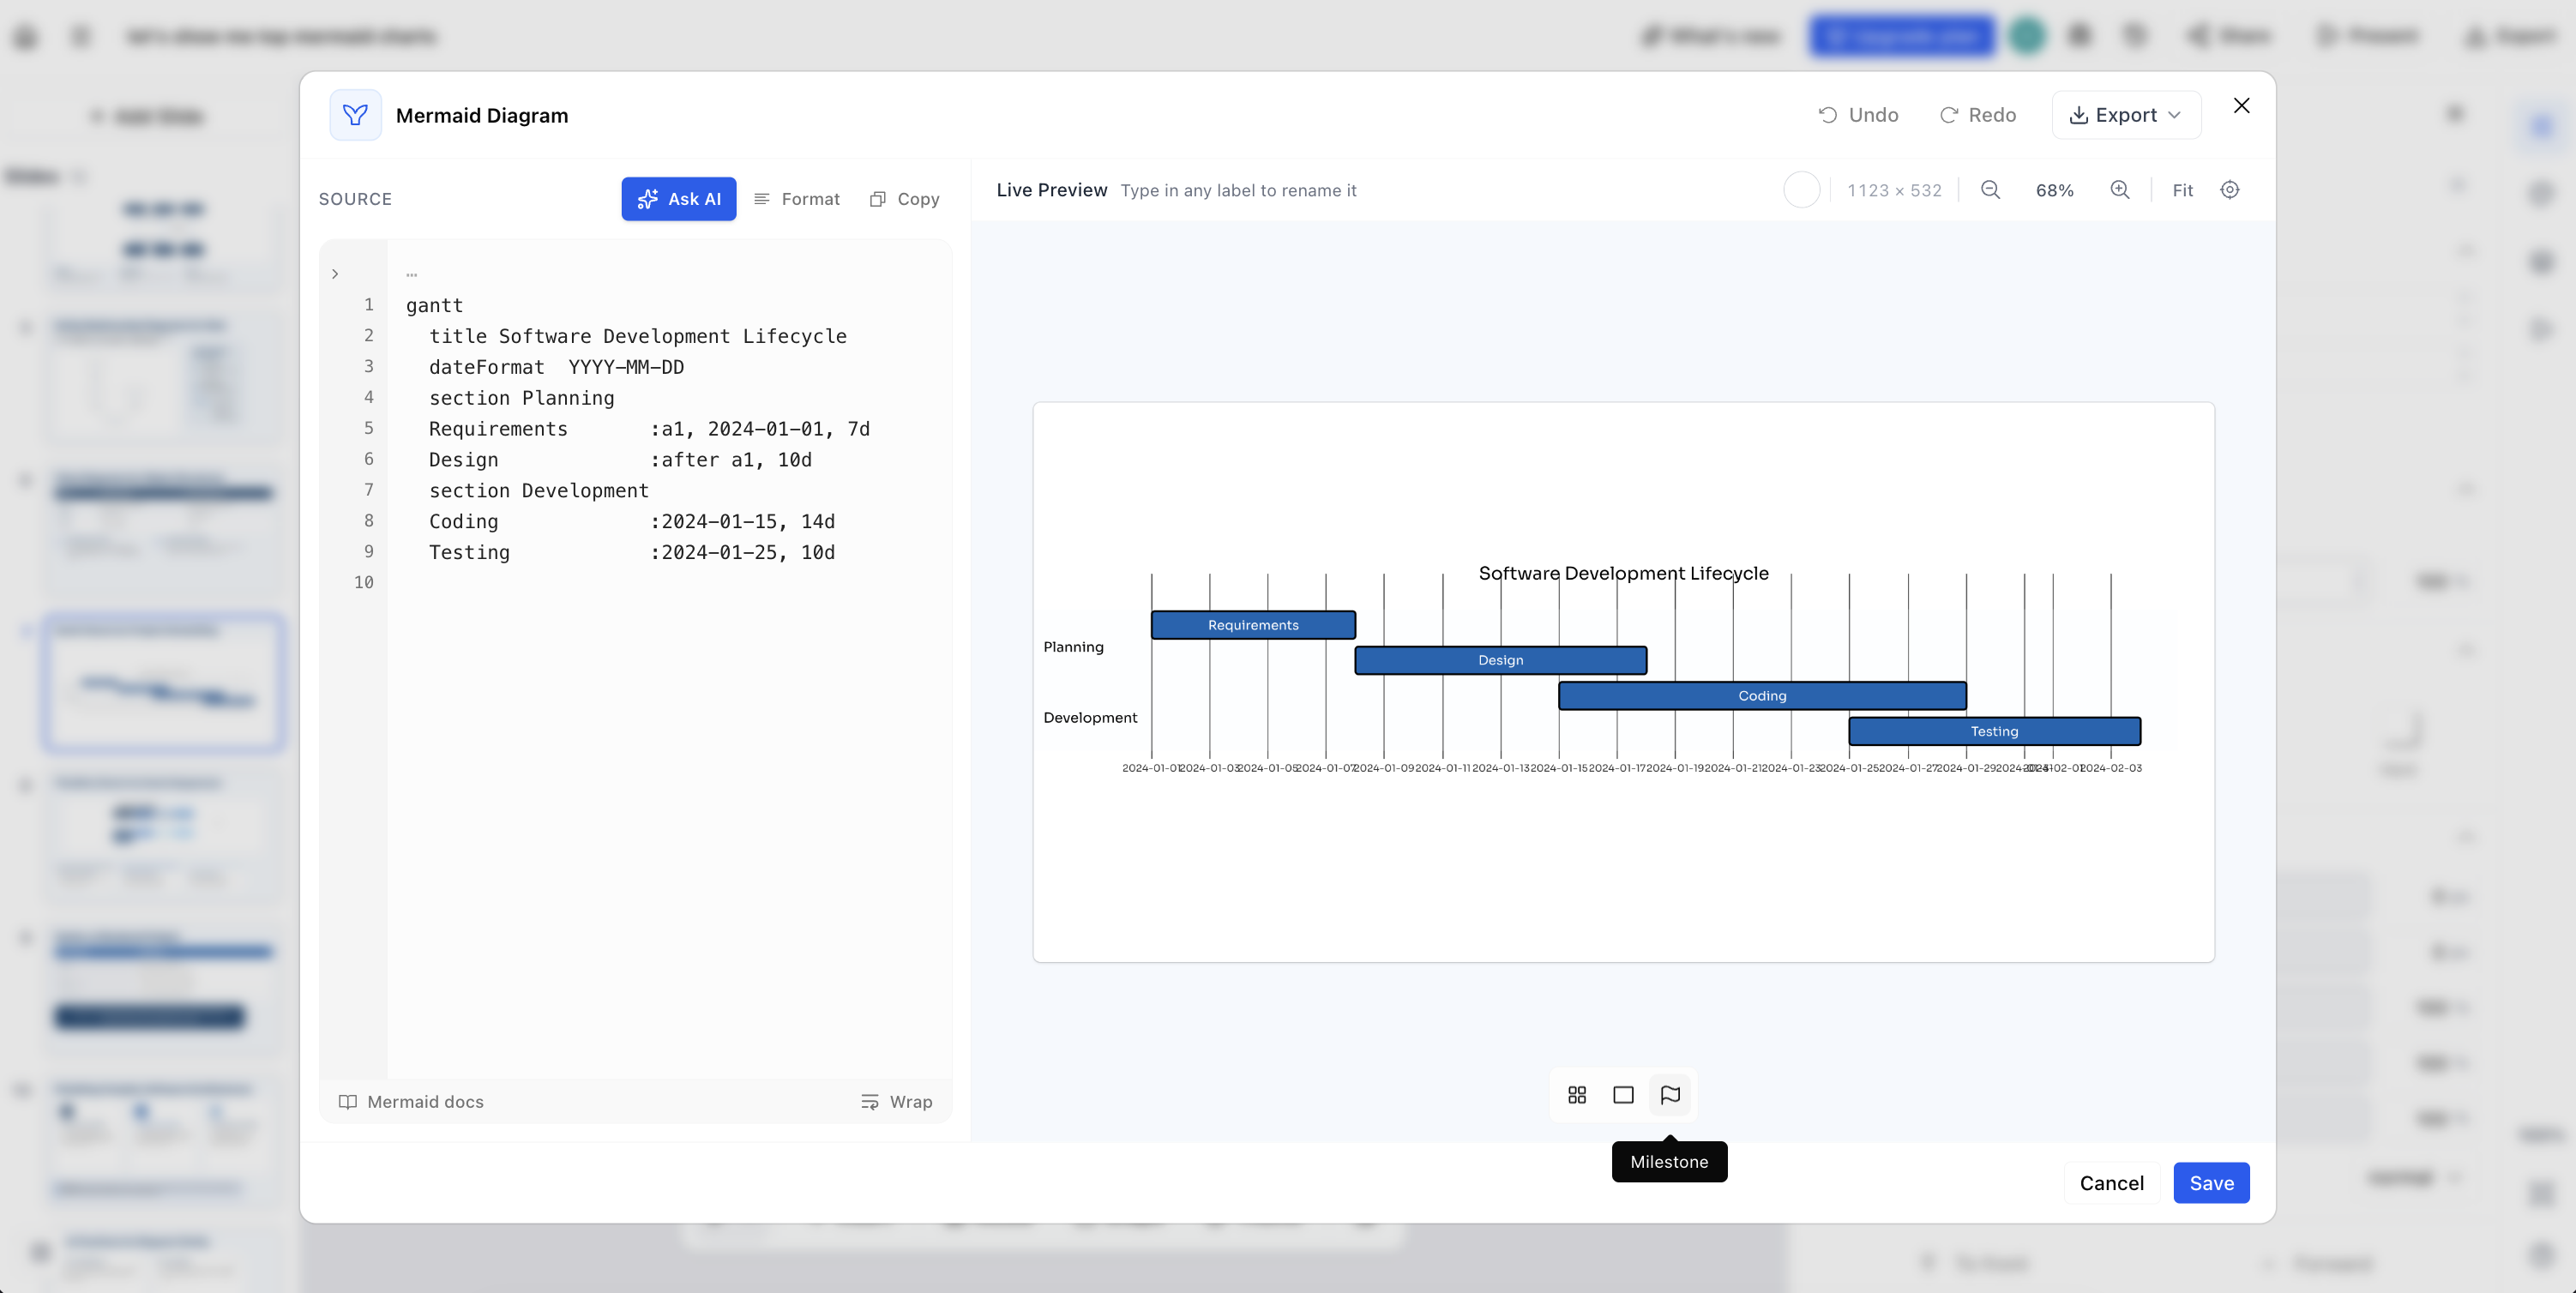
Mermaid diagrams are generated for you and can be added directly to a slide. They render in your deck's theme colors and stay editable as text, through inline labels, or with AI. See Mermaid diagrams: insert, edit, and export.
Links in generated presentations
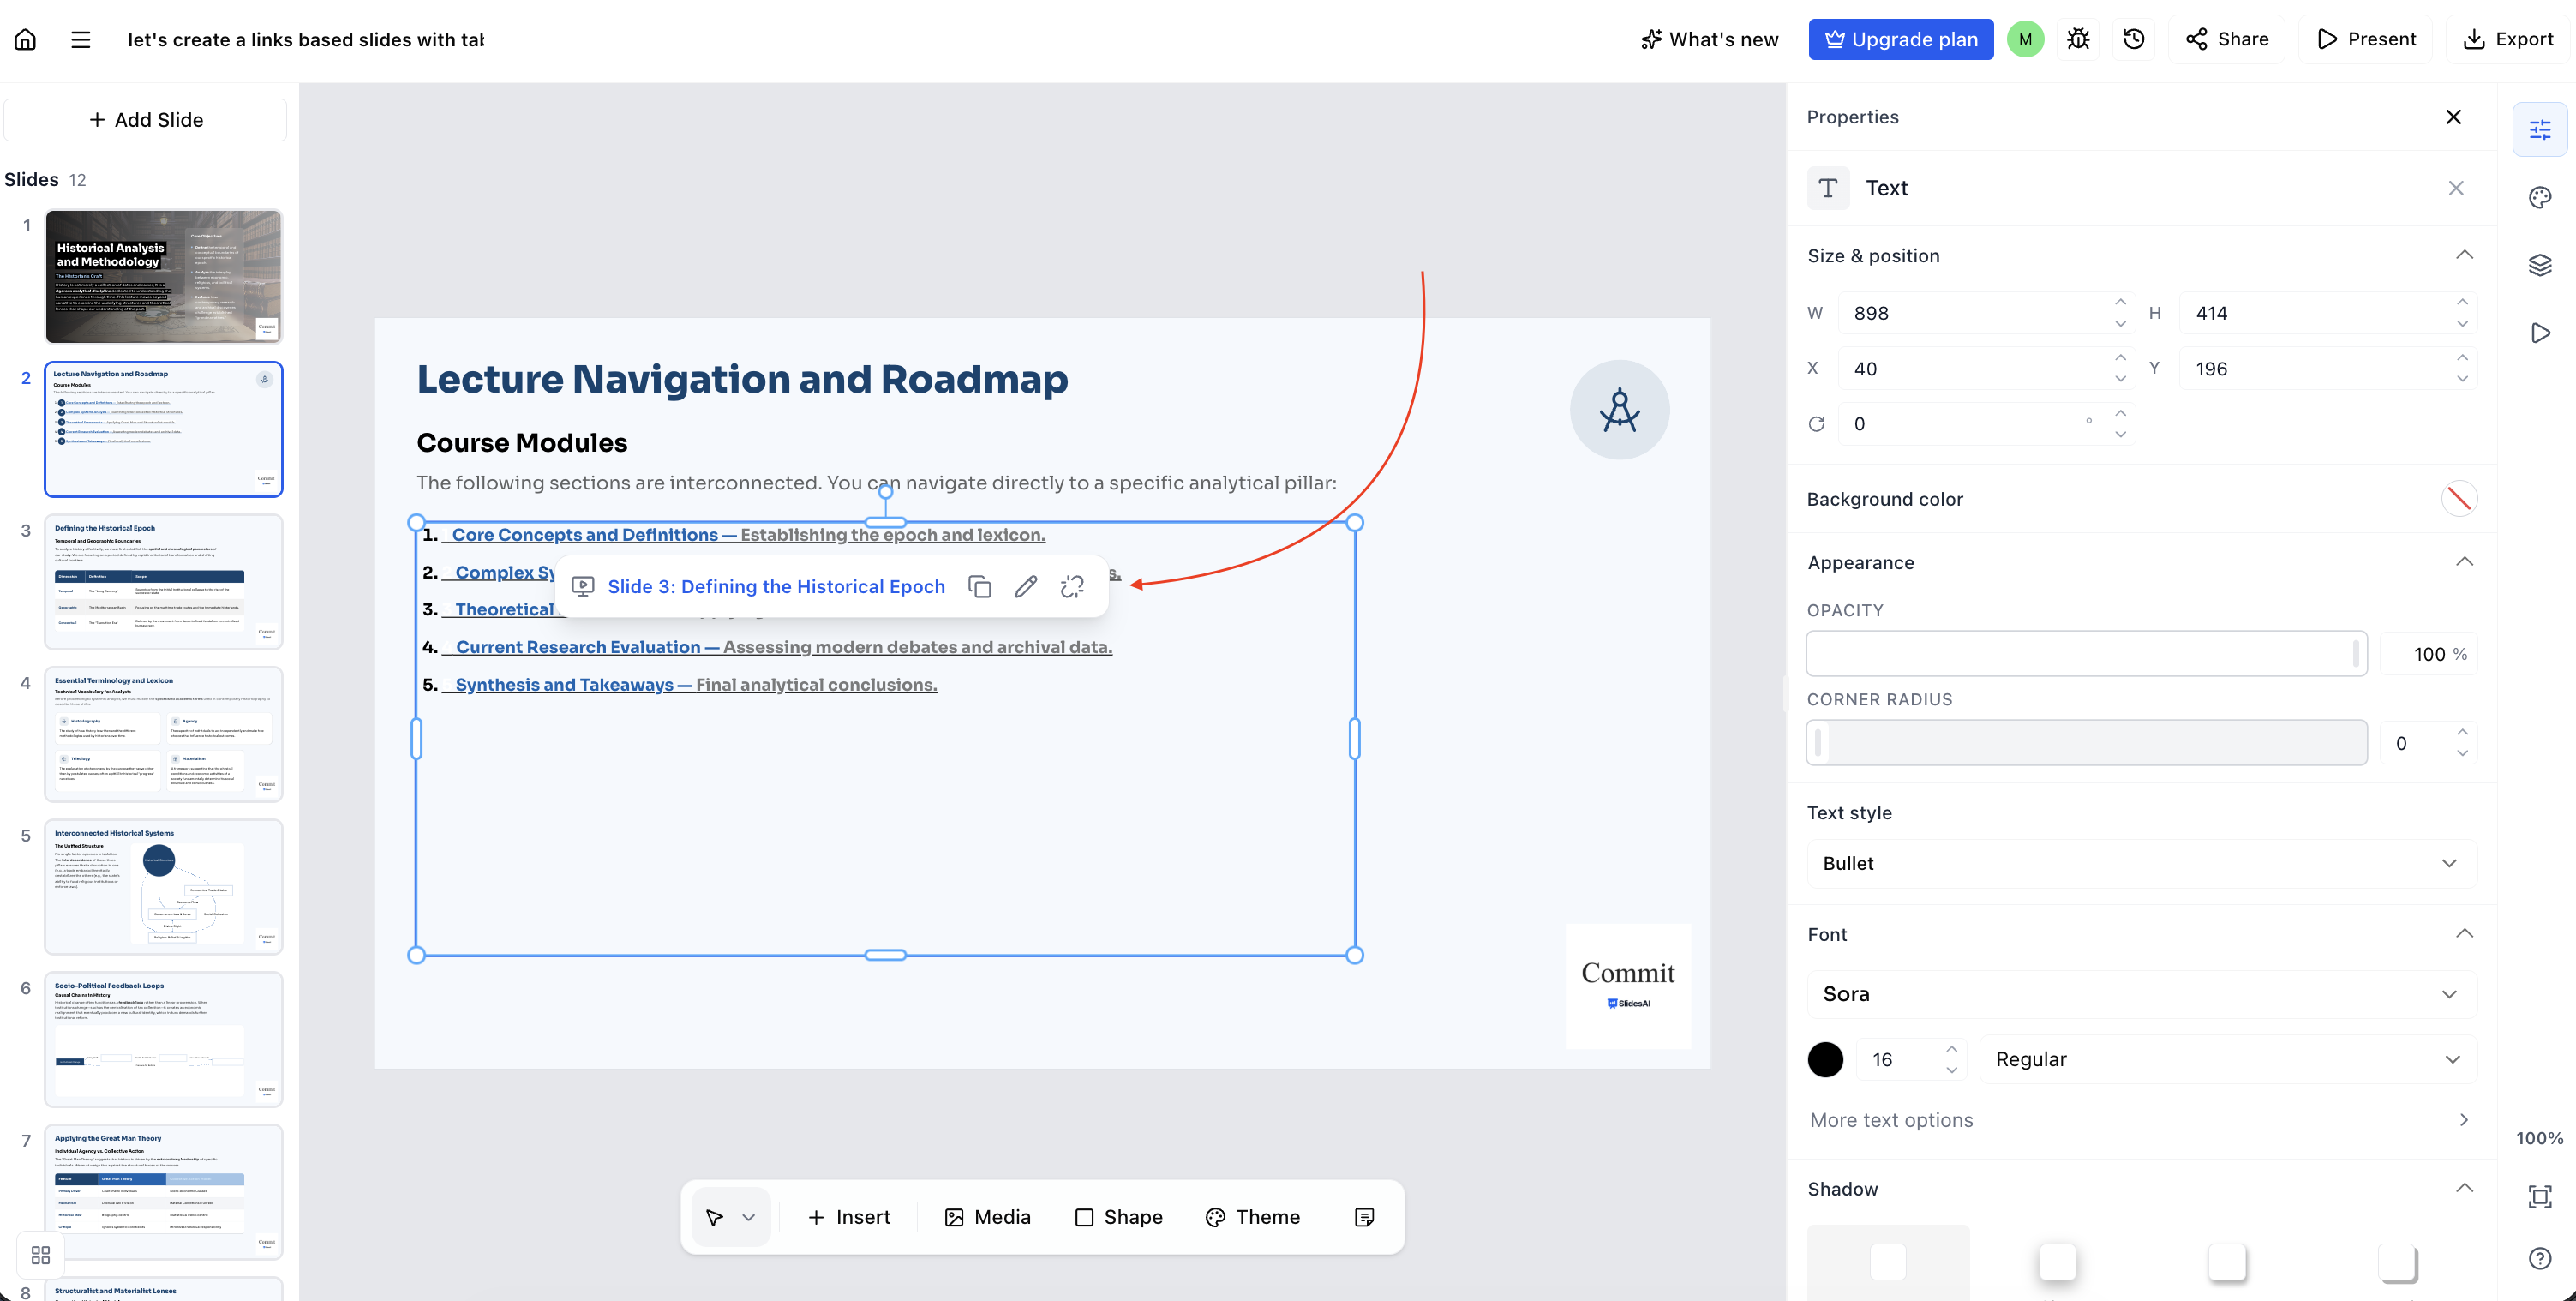
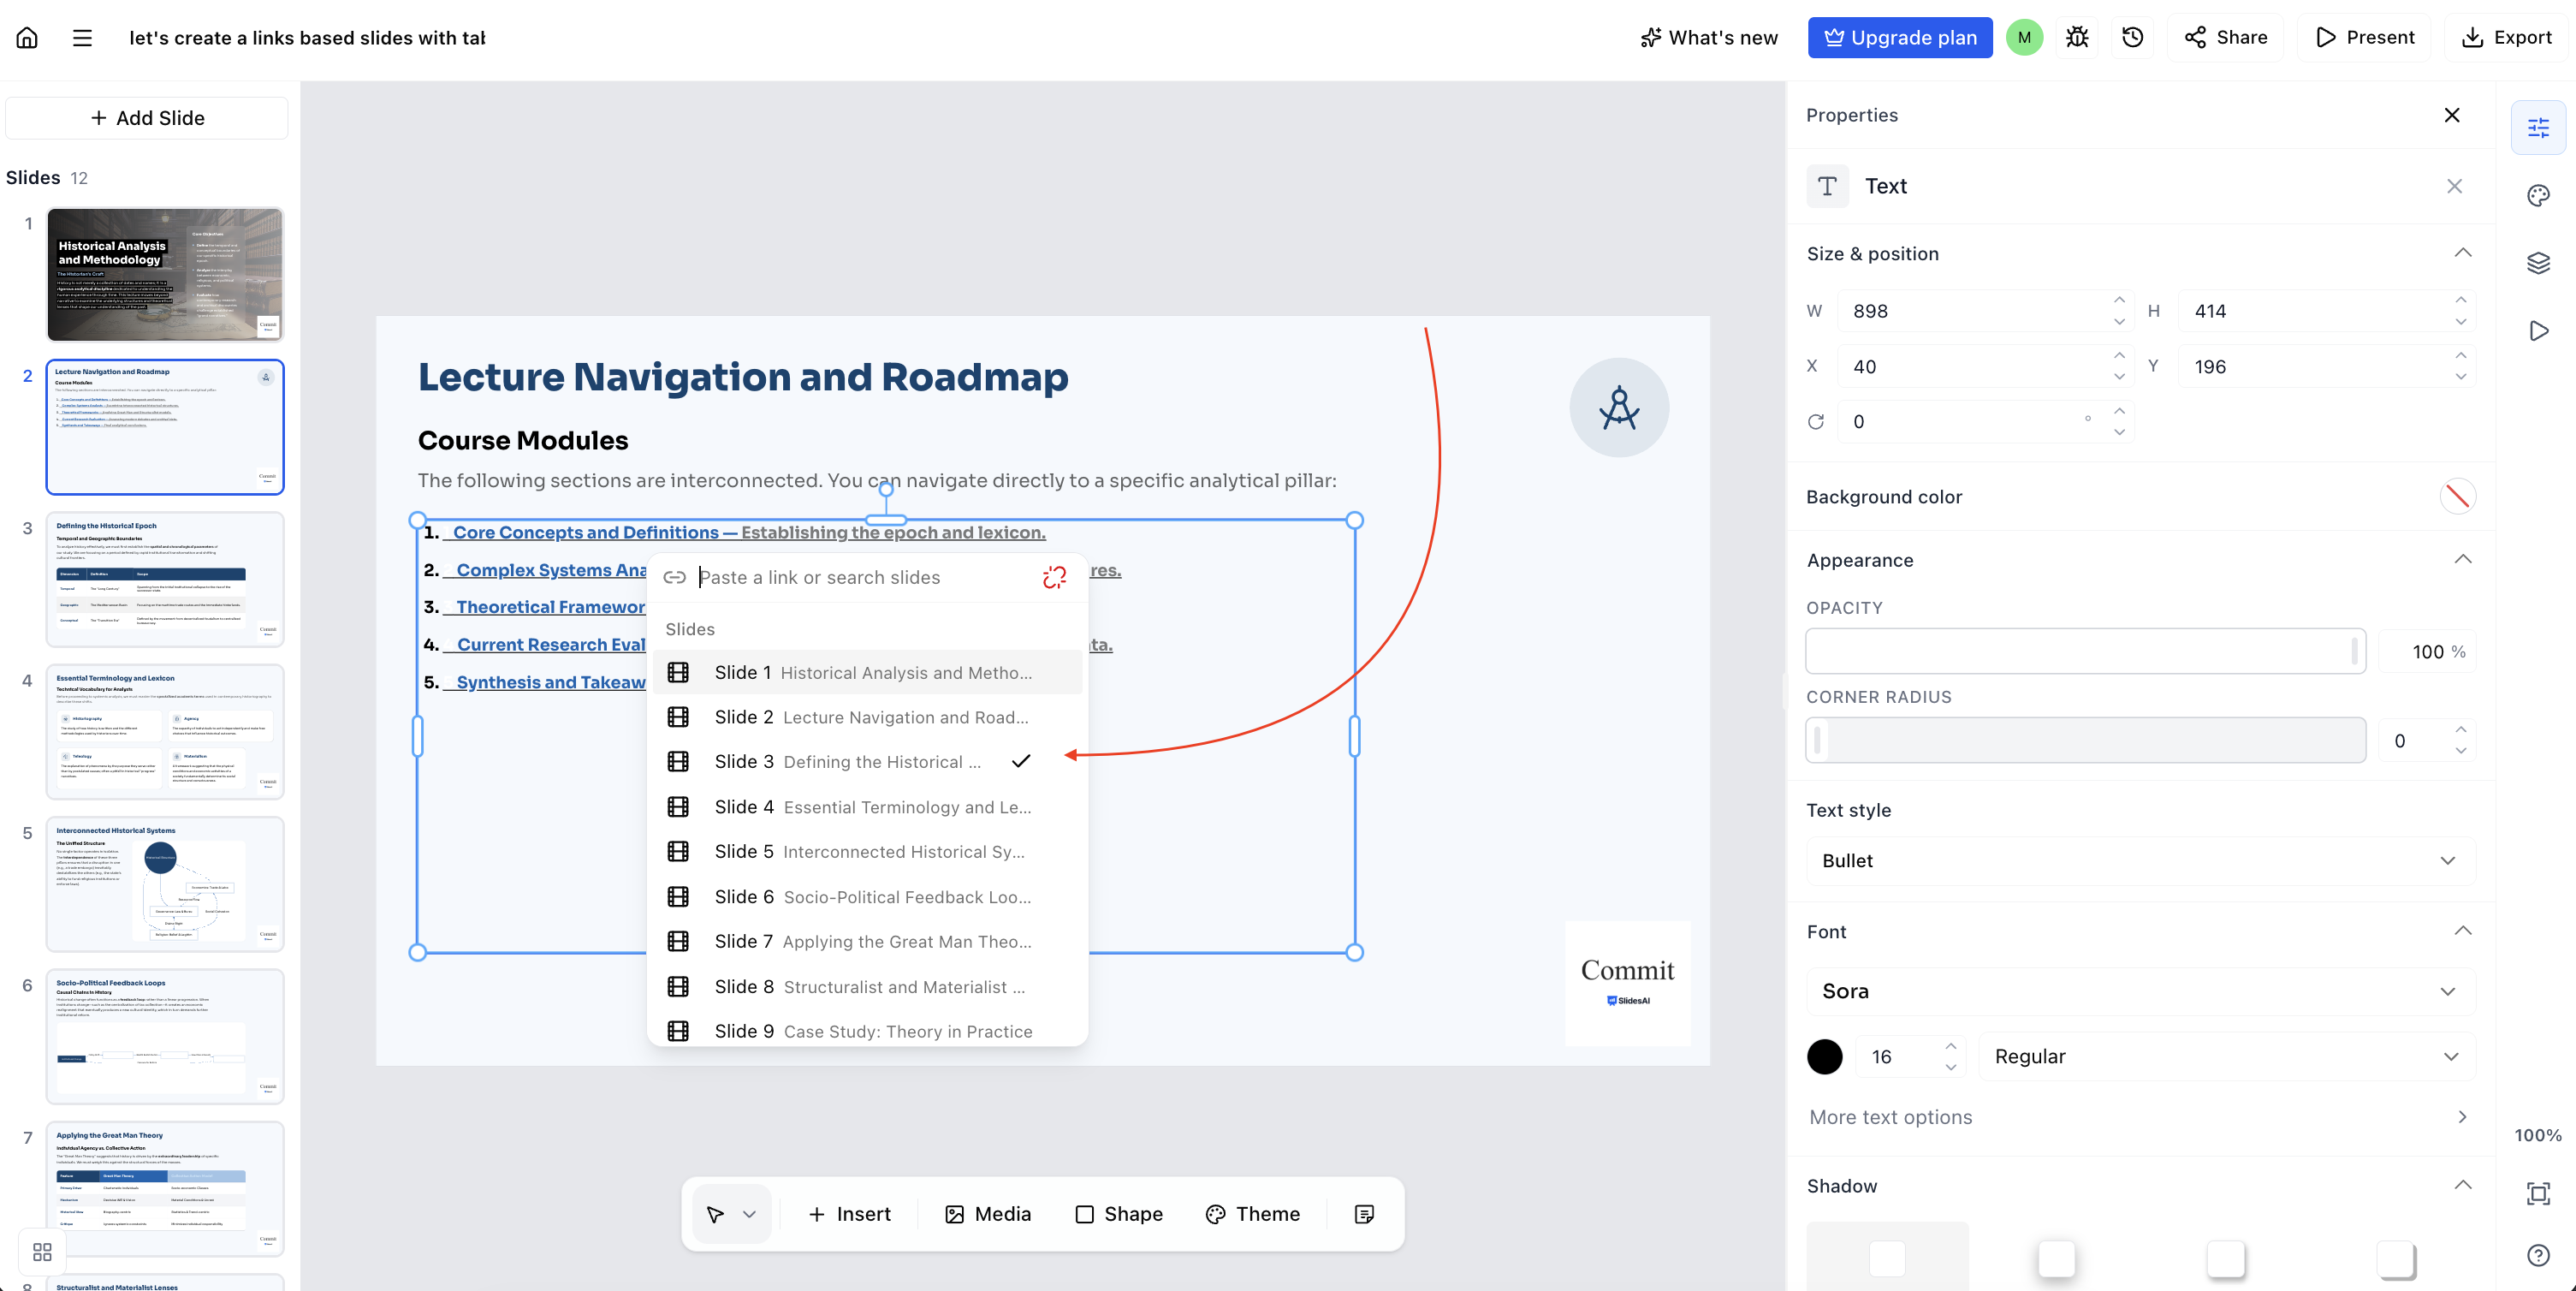
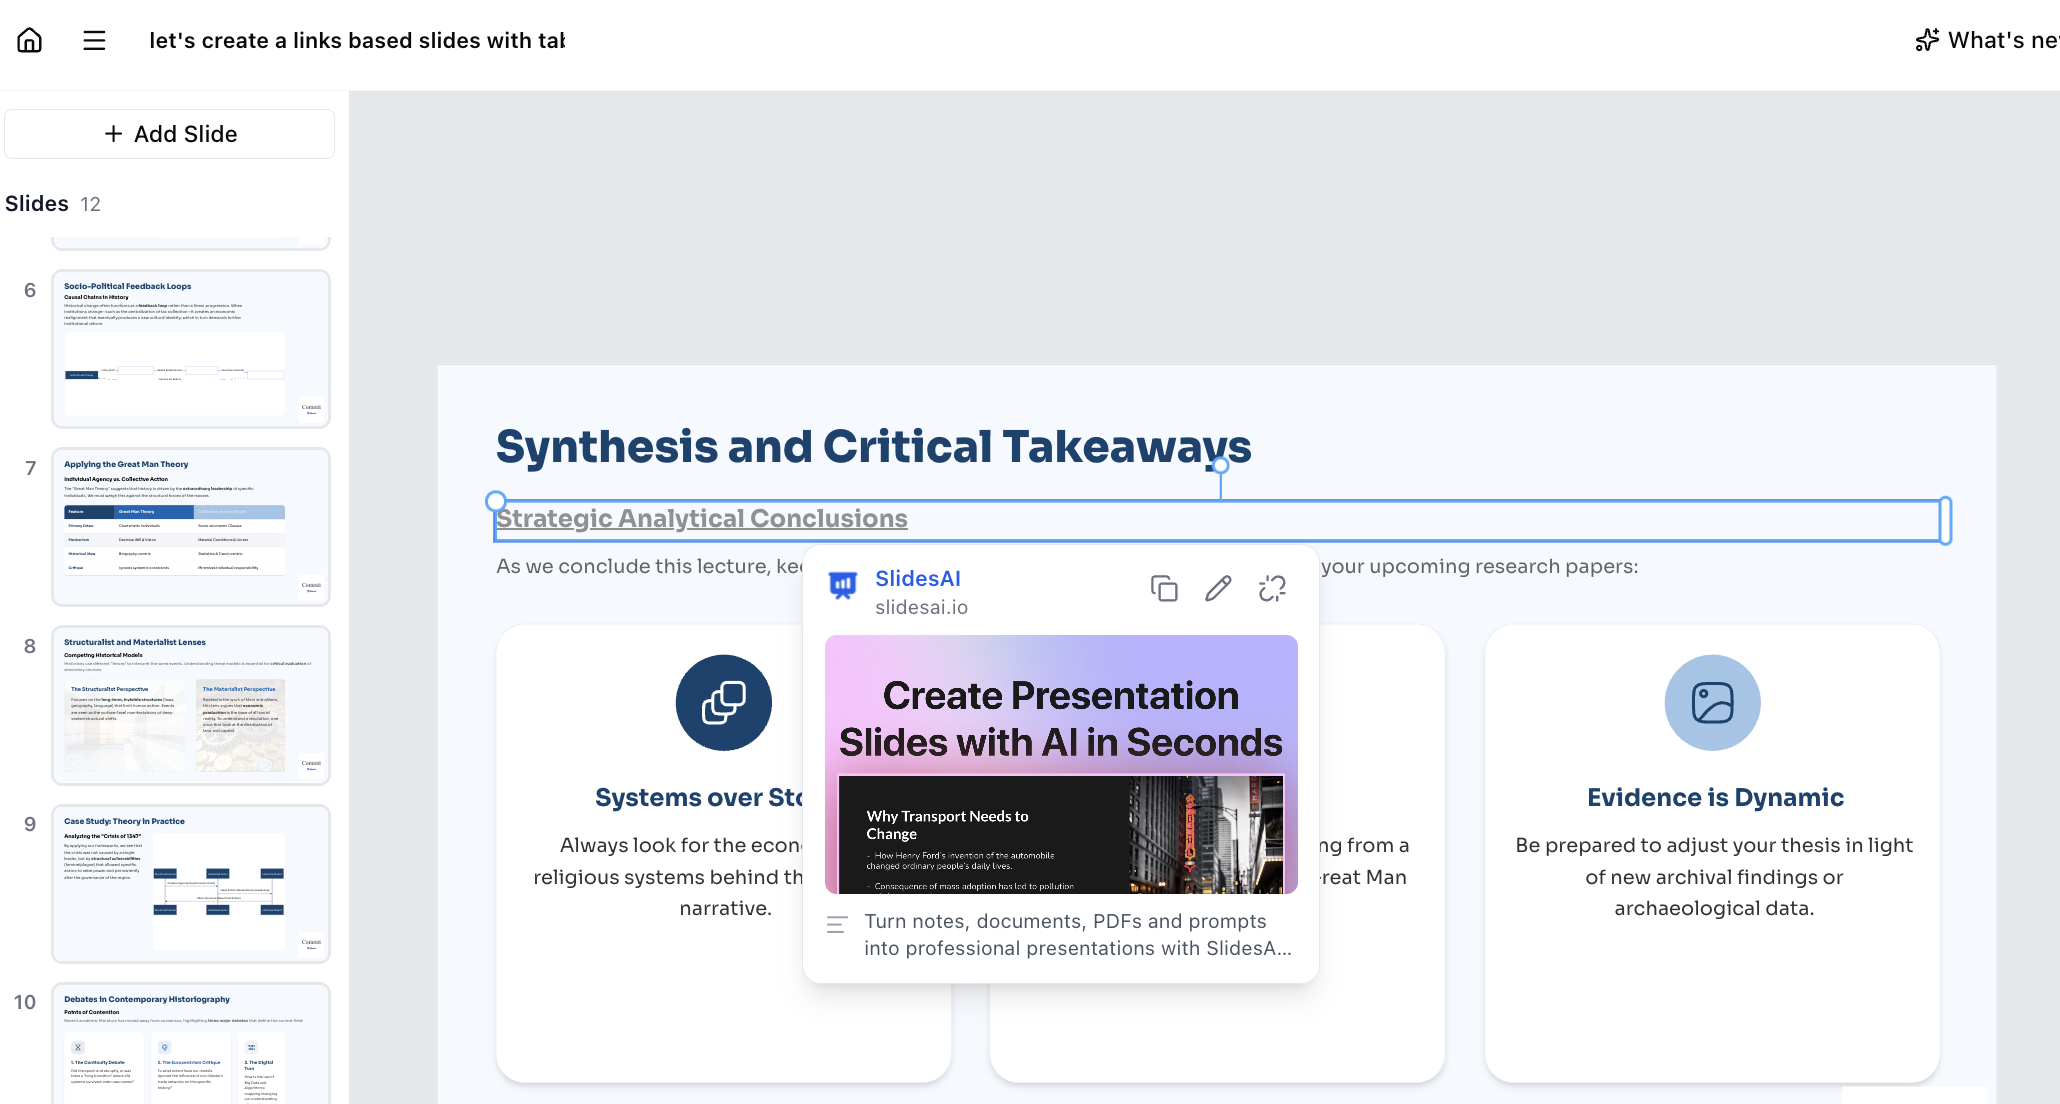
Safe web, email, phone, and slide links from your prompts, notes, and source documents are now carried into generated and refined presentations. Slide links keep pointing at the right slide after slides are reordered or removed, and unsupported or unsafe links are dropped. See Link a slide to another slide or a web page.
A redesigned bottom toolbar
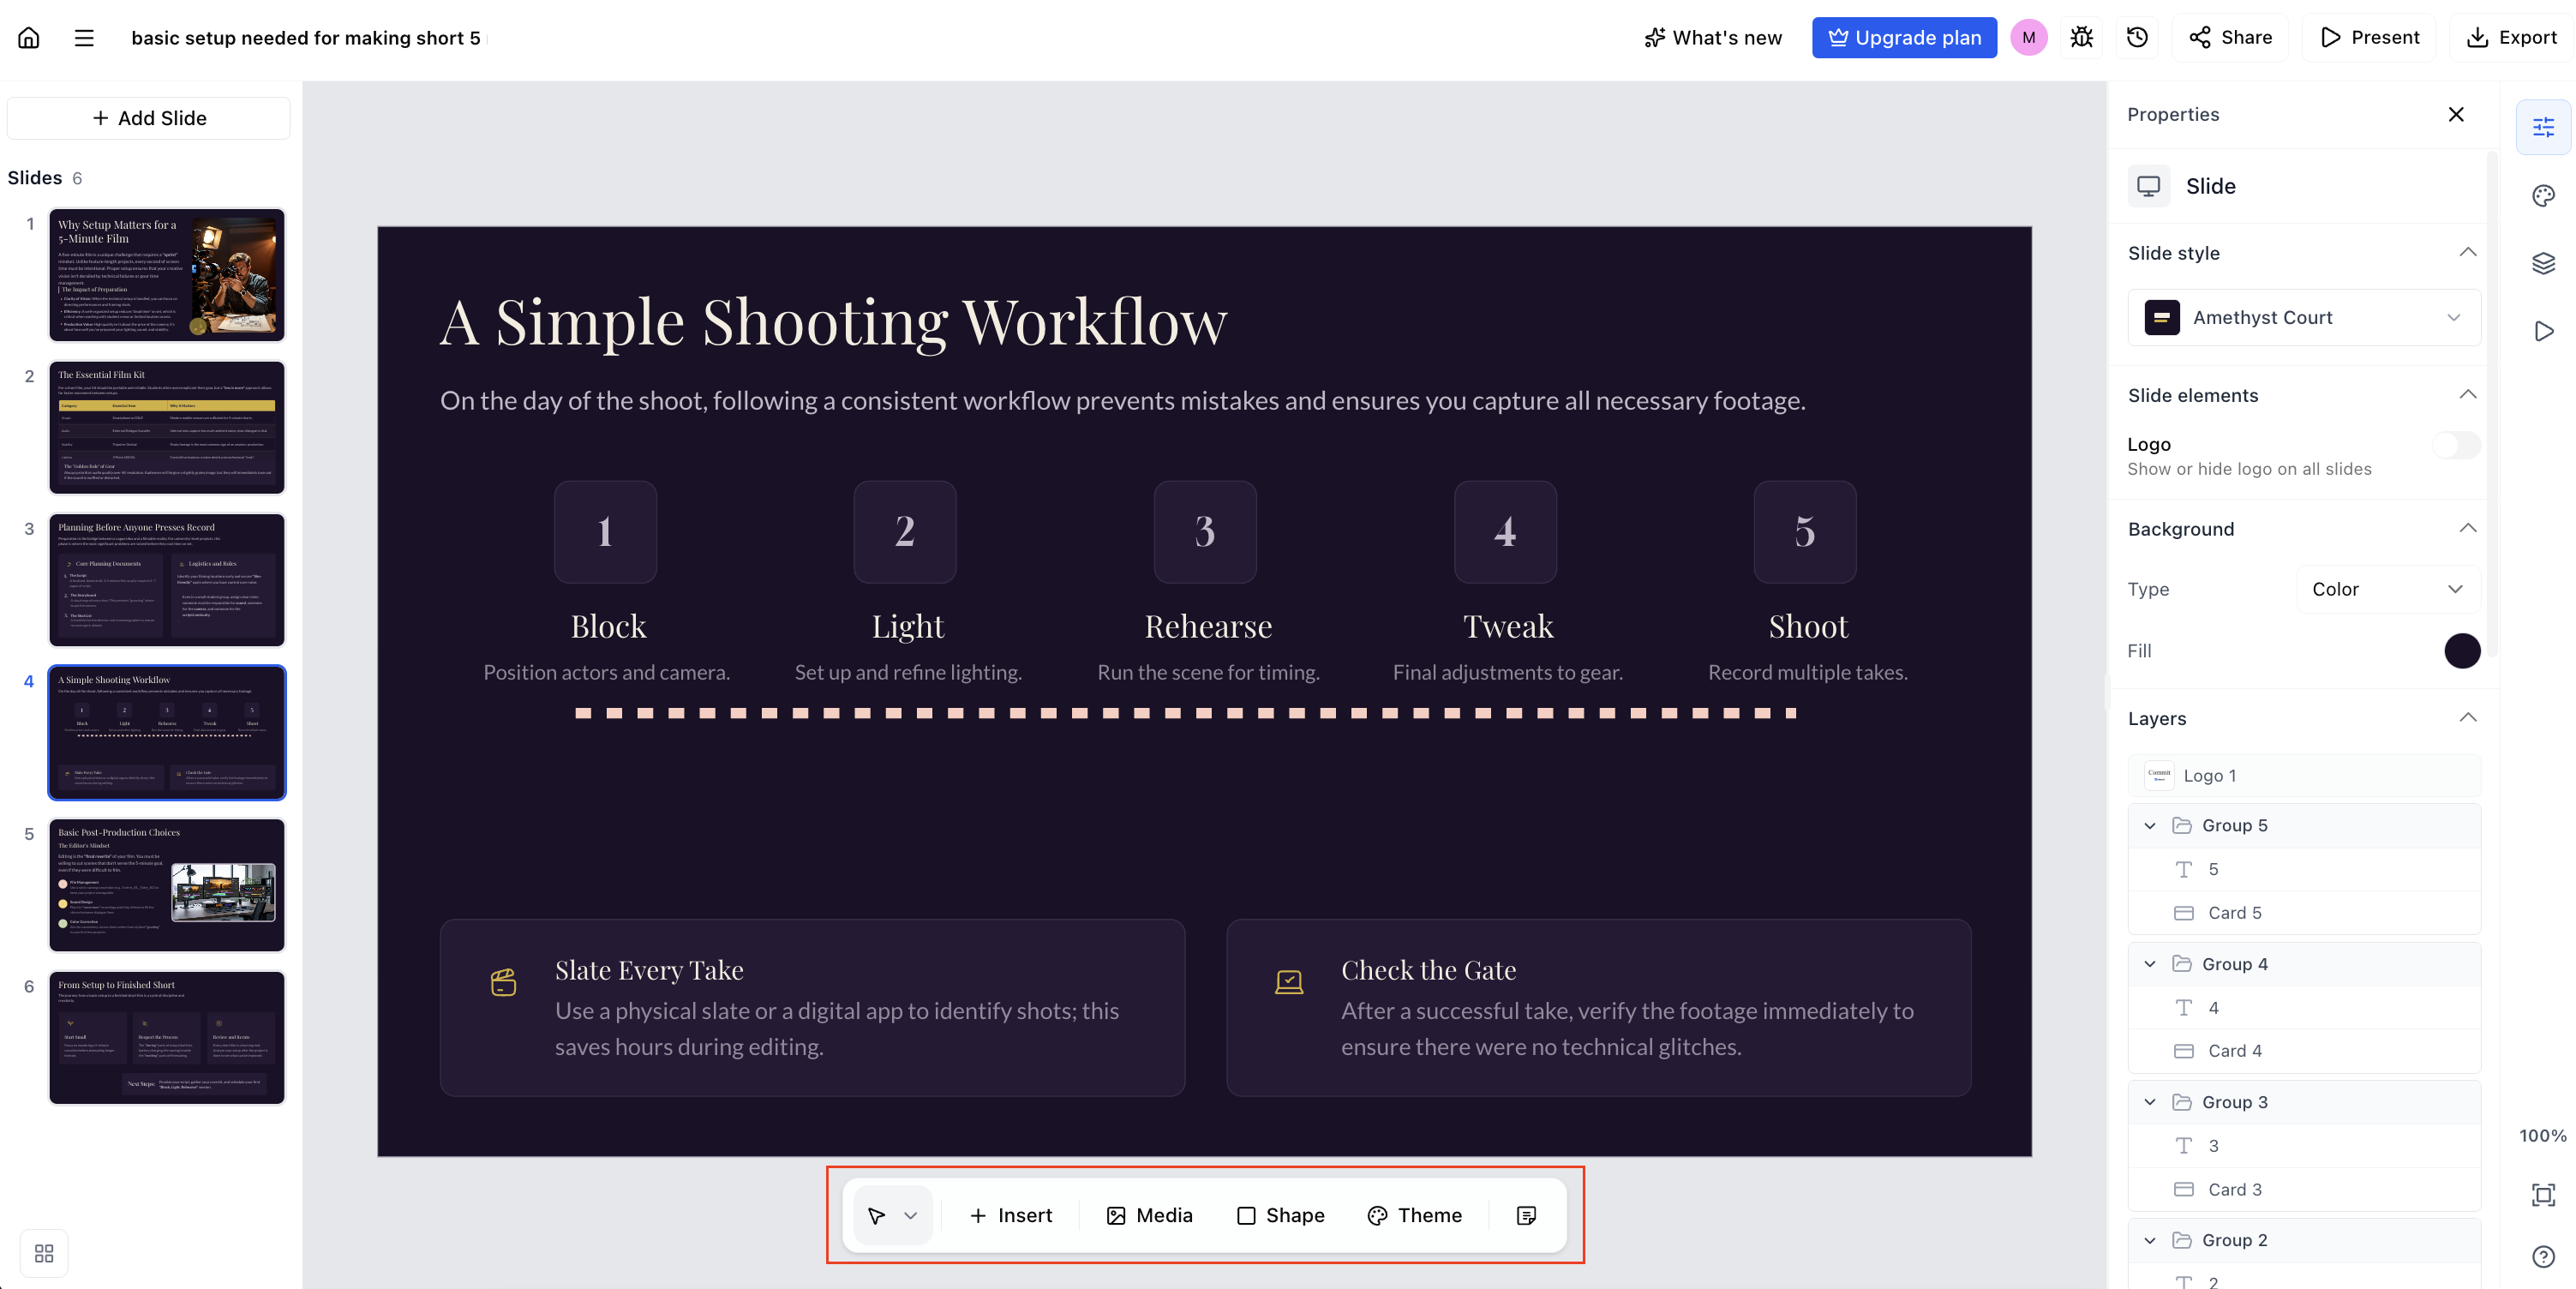
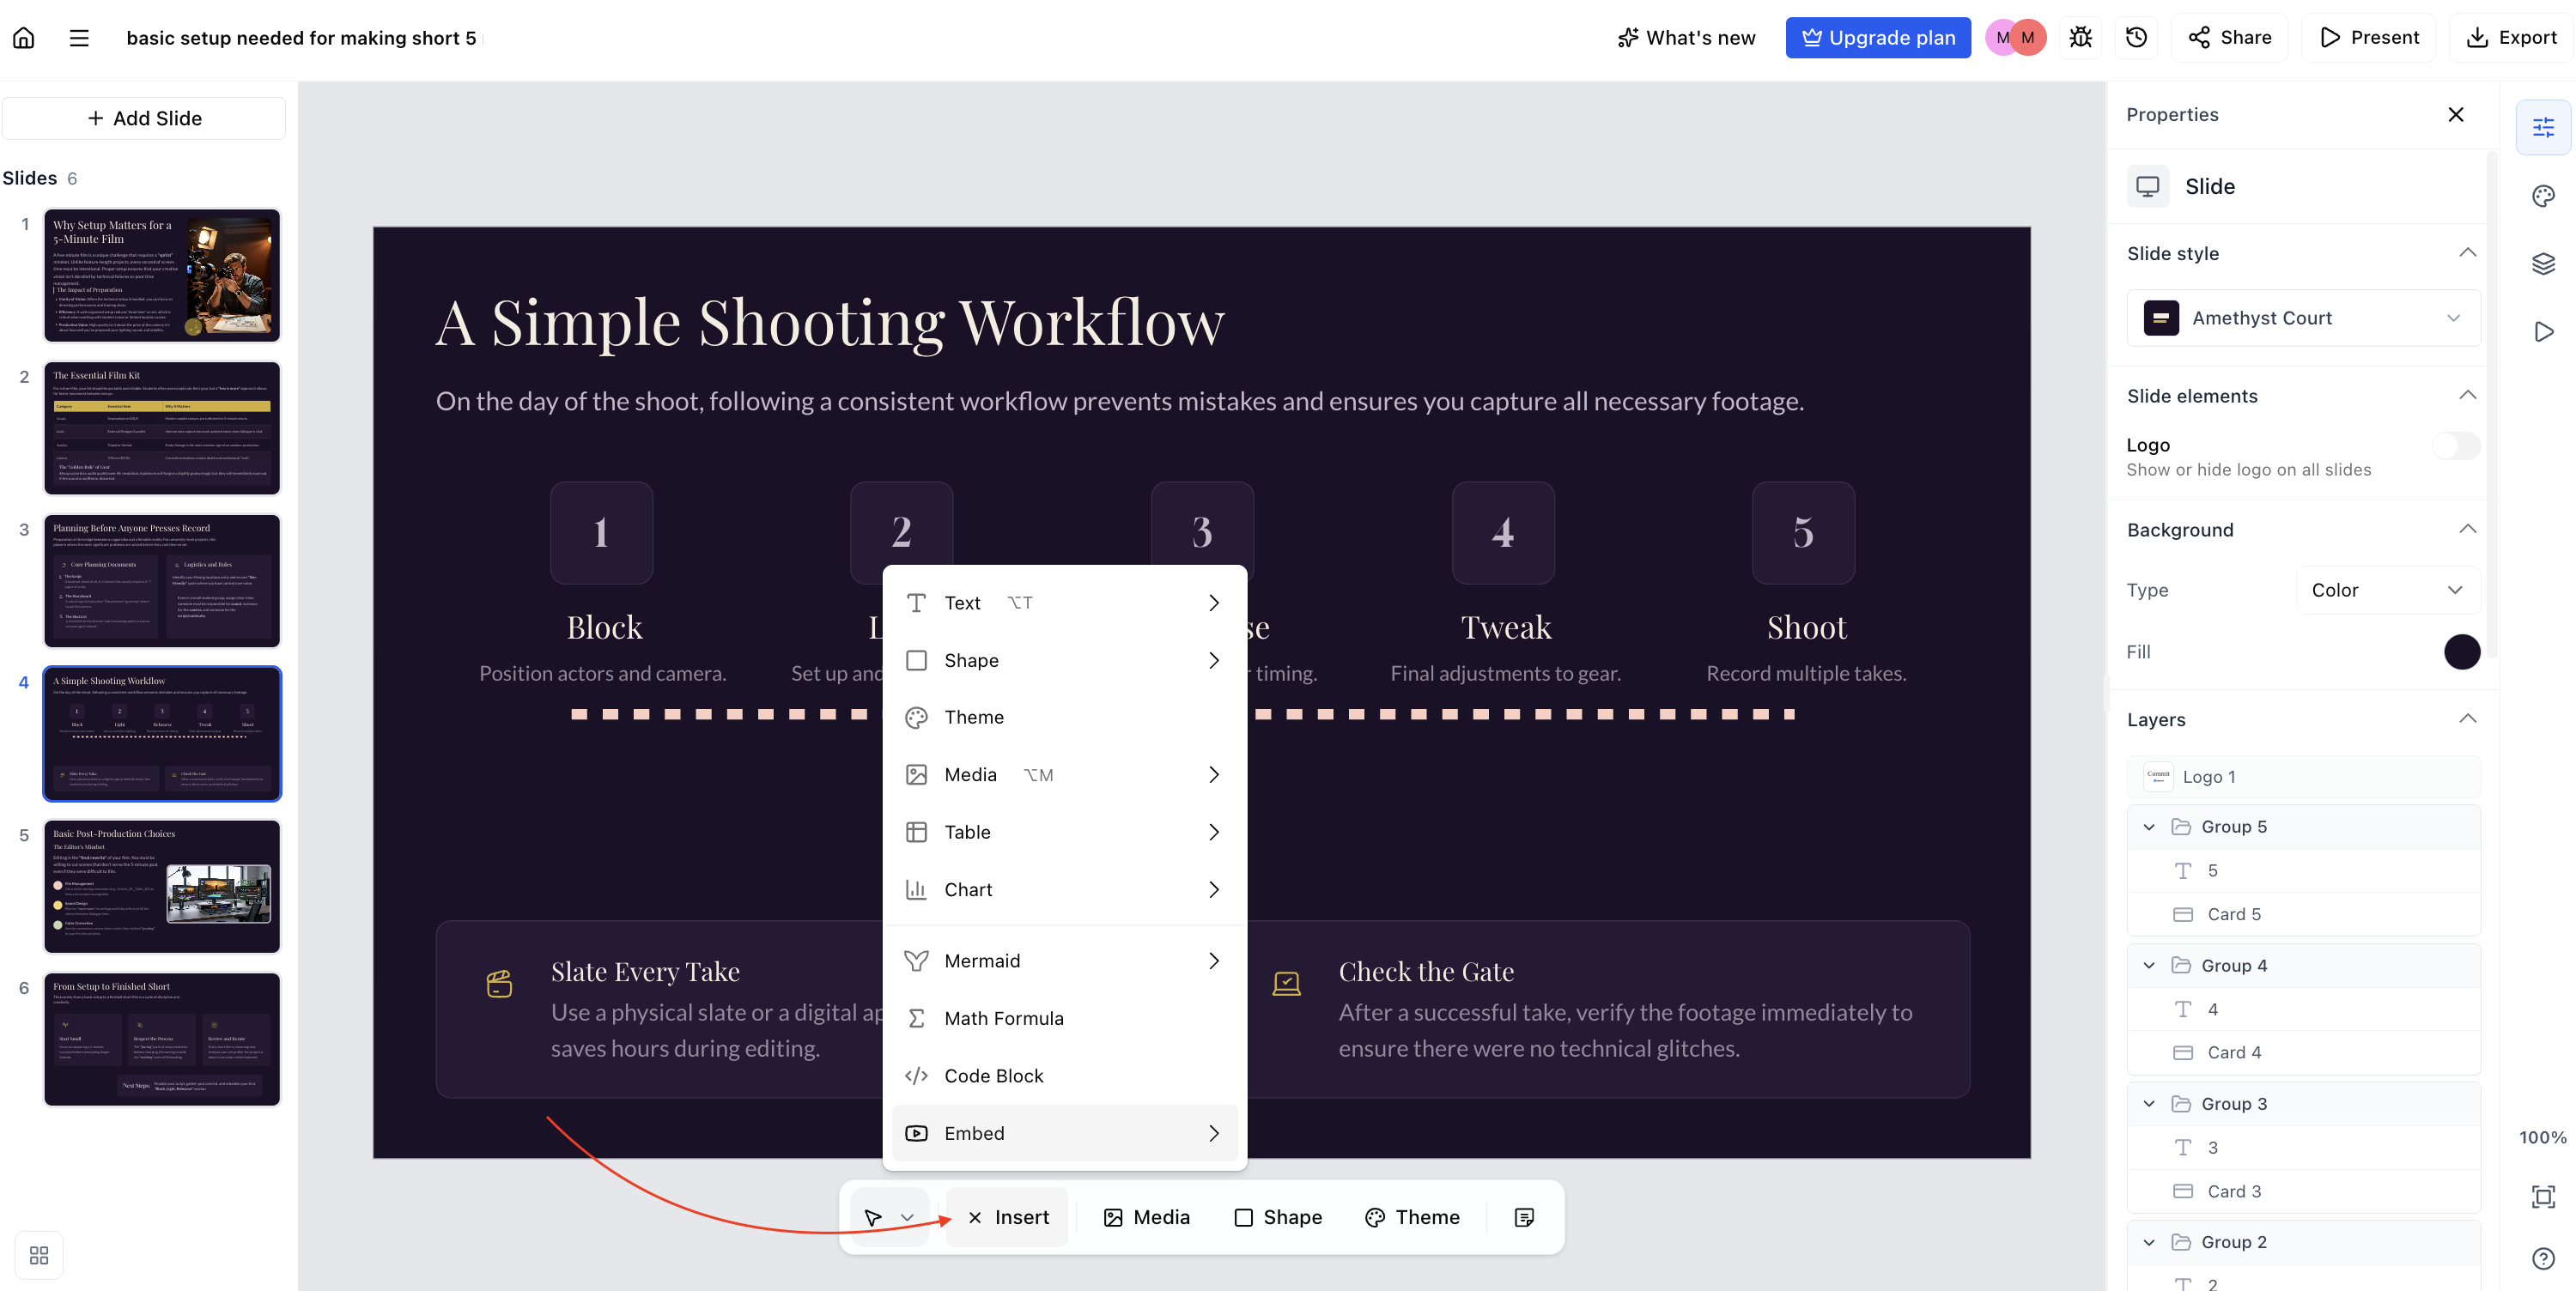
The editor's bottom toolbar now groups slide-building tools under a single Insert menu, with organized access to text styles, shapes, tables, charts, images, themes, diagrams, and embeds, plus quick actions for media, shapes, and themes.
Code blocks display fully [fix]
Generated code blocks are now sized from their actual content, so lines are no longer clipped at the top, bottom, or sides. Content below a block, such as a note or badge, reflows instead of being covered, and code that is too wide for its column is fitted automatically. The editor, thumbnails, and exports all use the same code-block sizing.
Improvements
Right-to-left charts — charts now display naturally in Arabic, Hebrew, and other right-to-left languages, with labels, axes, legends, and category order following the reading direction.
Bigger chart previews — charts show a larger preview in the editor and in Present mode, and chart previews and PowerPoint exports now match the editor more closely.